Link:https://marypatcampbell.substack.com/p/vaccines-reduce-risk-a-look-at-the
Graphic:
Video:
Excerpt:
I will put a few facts in front of you, and you think it through:
– The population age 85+ in the U.S. in 2020 was 6.3 million
– Through July 2021, there were a little over 180K COVID deaths for that group
– That’s about 3% of the age 85+ populationDo you think only 3% of the age 85+ population is vulnerable to COVID?
Pretty much all of them are “vulnerable”. The mortality rate for people age 85 (much less older) was 7.3% for females and 9.5% for males in the most recently available tables. It only goes up from there.
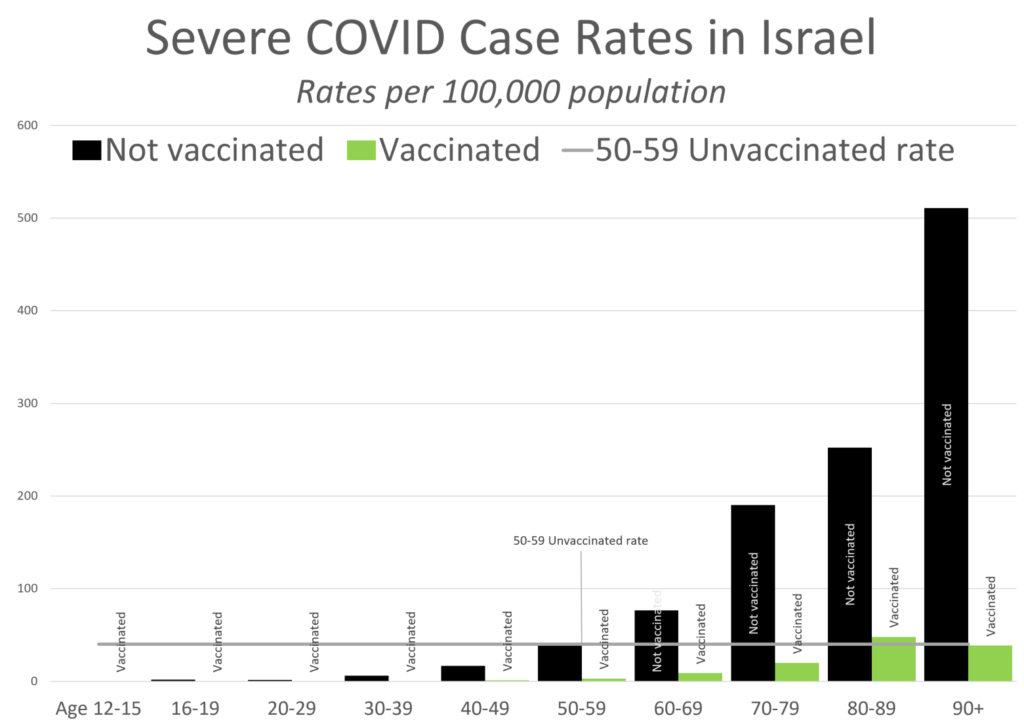
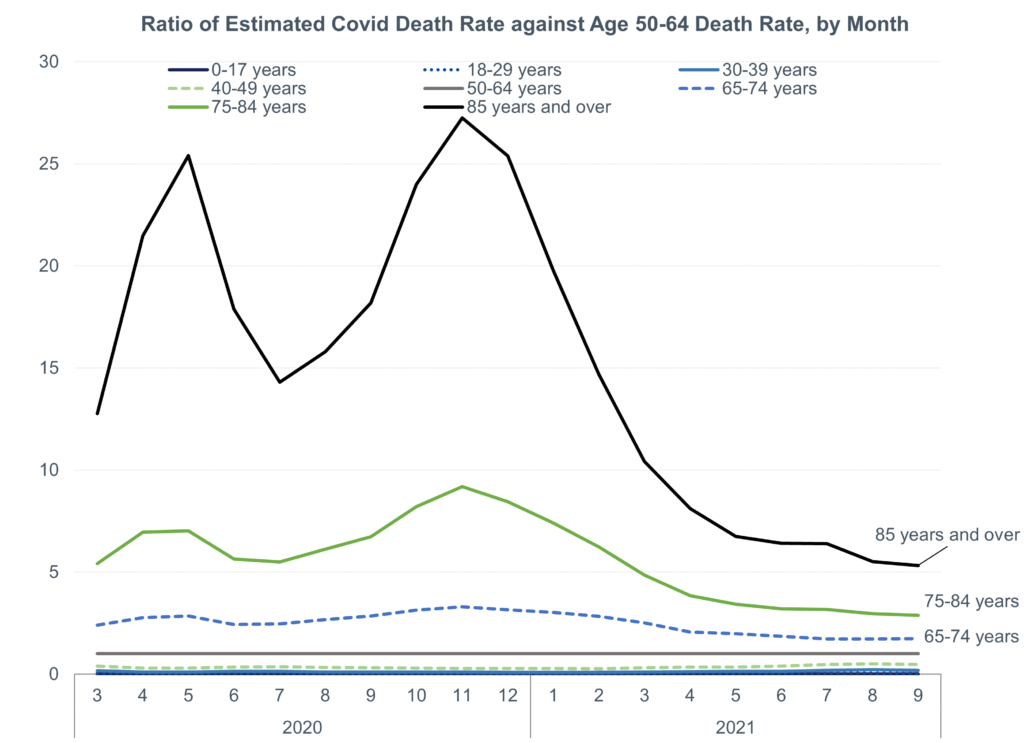
There is a huge difference in mortality by age for just non-pandemic years, and it’s also true for COVID.
There may be a few hardy souls with a base risk similar to the middle-aged without vaccines, but the percentage is not high.
The vaccines have been having an effect in cutting risk.
Author(s): Mary Pat Campbell
Publication Date: 18 Oct 2021
Publication Site: STUMP at substack