Link: https://marypatcampbell.substack.com/p/mortality-with-meep-top-causes-of
Graphic:
Excerpt:
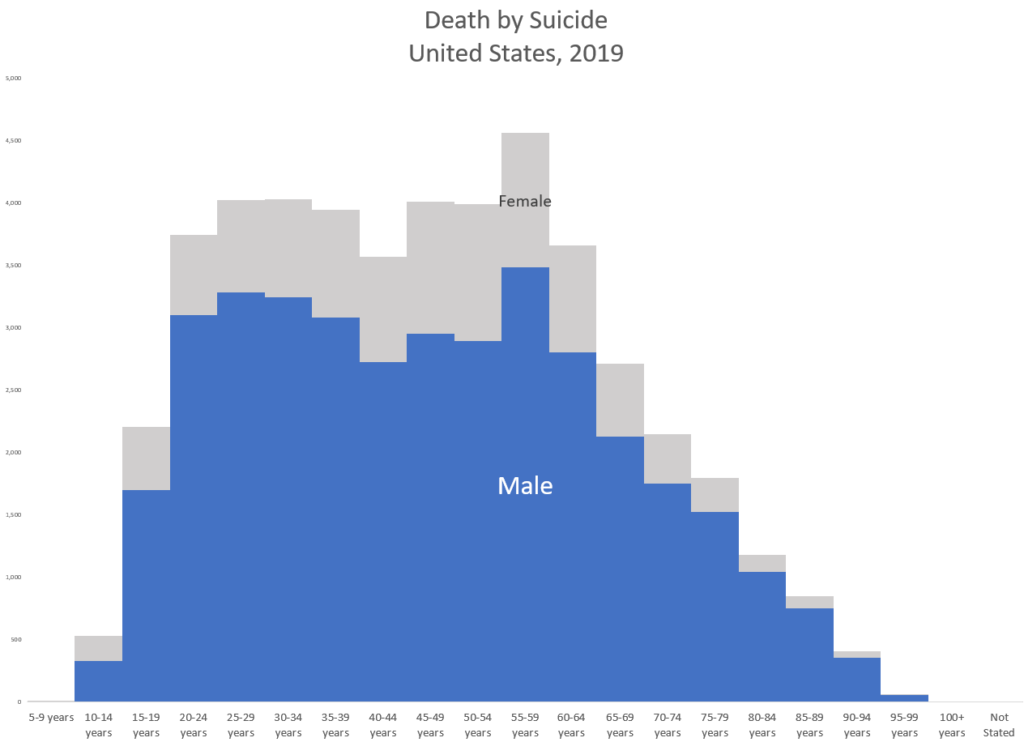
You’ll see that among adults, the age range with the most suicides are people age 50-55. That’s due to two things: the number of people in that age range (early Gen X, so tailing off from Boomers) and the rate. For each age group far more males die by suicide than do females.
You can see that deaths by suicide in number drop off in old age…. but that’s because the population is dropping off in size (as mortality rates accelerate at high ages).
Author(s): Mary Pat Campbell
Publication Date: 12 April 2021
Publication Site: STUMP at substack