Graphic:
Excerpt:
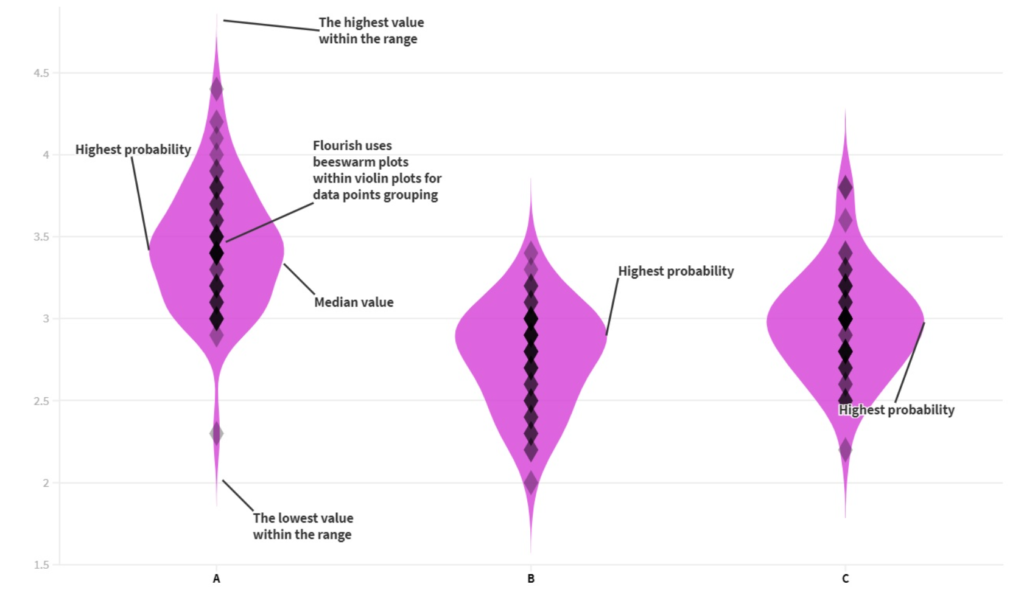
How to interpret a violin plot? While they may look a bit overwhelming at first sight to understand, violin plots are easy to read. I created a graph that shows the anatomy of the volin plot. The top, bottom and middle of the violin are the highest, lowest and middle value point respectively, while the widest part of the violin shows the highest probability. The widest part of the violin can appear on any spectrum of its height, it can be close to the highest, lowest or mid value point.
Author(s): stelayordanova
Publication Date: 3 March 2021
Publication Site: stelayordanova