How Much Free Money Stimulus Still Hasn’t Been Spent?

Link: https://mishtalk.com/economics/how-much-free-money-stimulus-still-hasnt-been-spent

Graphic:
Excerpt:

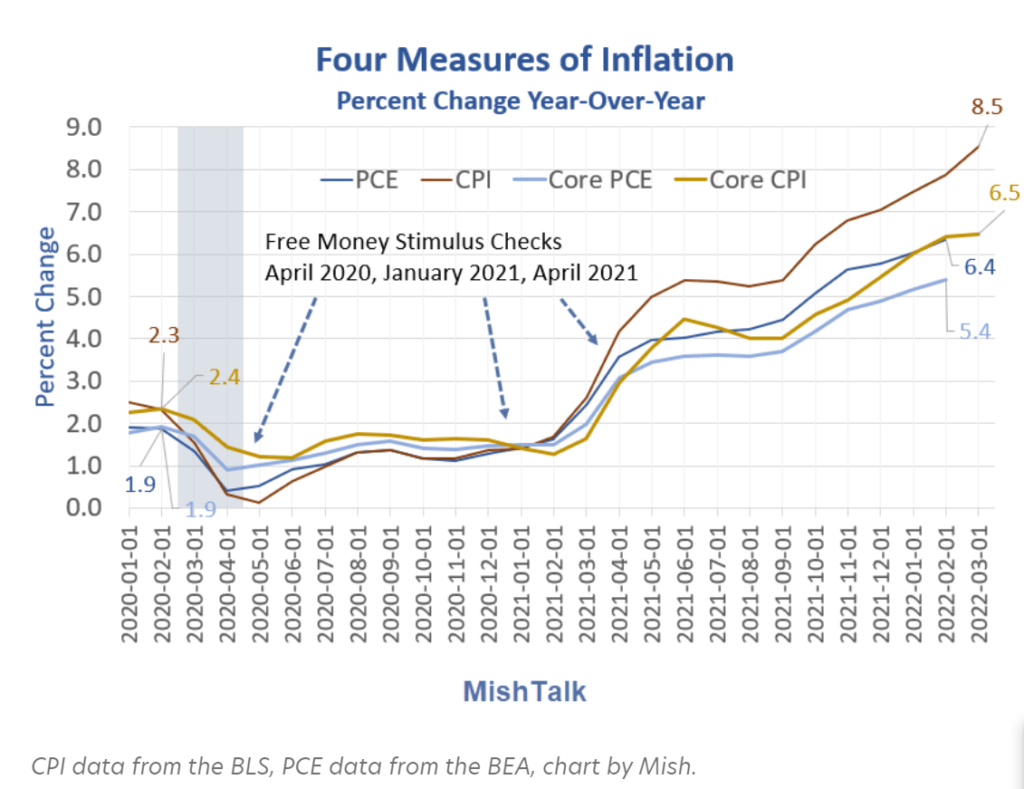
The question is not as straight forward as it looks. The gap between spending and income isn’t constant. 

Free money that goes to bottom rung households tends to immediately get spent. The higher the rung, the more the savings. This is complicated by the fact that most of the money was supposed to go to lower tiers, and further complicated by corporate fraud, especially in round one. 

More importantly, personal spending does not count mortgage paydowns, stock market or Bitcoin purchases, capital expenses for businesses, drug money, other illegal uses, or money sent to relatives overseas. 

….

The Peterson Foundation reports direct checks were $292 billion in round one, $164 billion in round two, and $411 billion in round three.

There was $850 billion of direct payments to taxpayers with the biggest and most unwarranted round the last.

Spending data suggests free money, at least most of direct payments, already did enter the economy. 

However, that does not factor in unpaid rent via eviction moratoriums or SNAP (Supplemental Nutrition Assistance Program), formerly Food Stamps, which I will address in a separate post. 

So yes, there still could be a pile of unspent stimulus savings, possibly much higher than my $2 trillion summation estimate, again with my caveats on investments, sending money overseas, etc.  

Author(s): Mike Shedlock

Publication Date: 22 Apr 2022

Publication Site: Mish Talk
Inside Nebraska’s Surprisingly Effective Covid Strategy

Link: https://www.politico.com/news/magazine/2022/04/22/nebraska-covid-response-pete-ricketts-00026993

Graphic:

Excerpt:

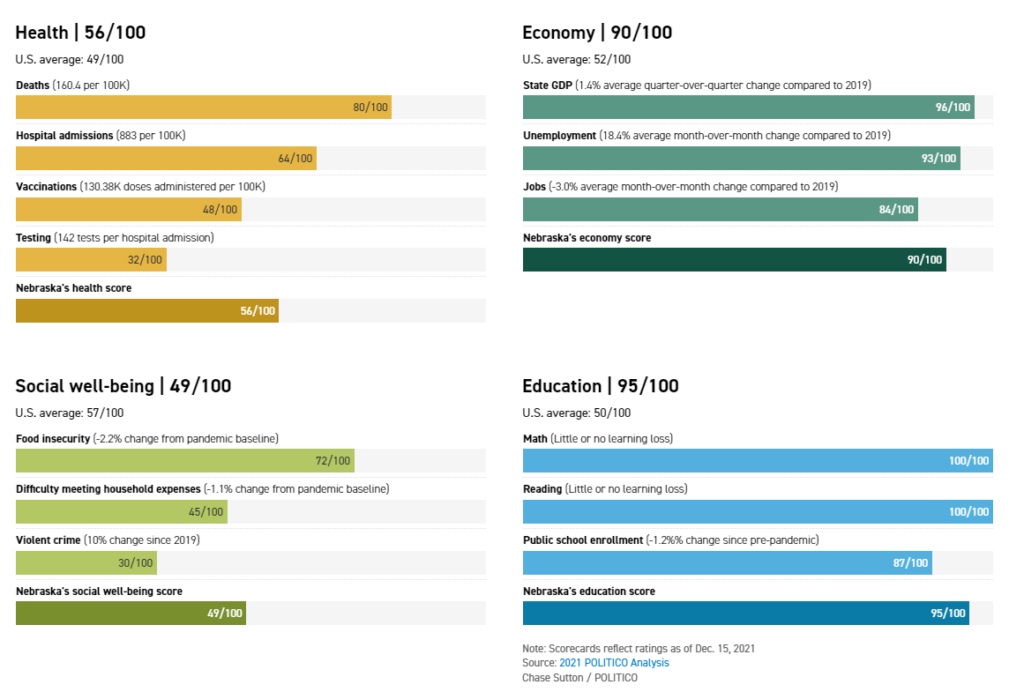
This conversation about protecting hospitals, back in the era when New Yorkers were still being encouraged to go to restaurants, well before the coasts’ contagion began closing in on the Midwest in earnest, helped define what became, by some measures, one of the most effective and balanced Covid responses in the United States. Ricketts is a mandate-shunning Republican who runs a heavily Republican and rural state with a middling vaccination rate — factors that have been linked to worse pandemic health outcomes in other states. He never ordered a statewide shutdown when 43 other governors, Democrats and Republicans, did so; he has stood against, or even supported lawsuits over, local mask requirements; he has told state agencies not to comply with federal vaccine mandates and gotten scolded by the U.S. secretary of defense for objecting to such requirements for the National Guard. And yet by the fall of last year, when POLITICO crunched the data of state pandemic responses on a combination of health, economic, social and educational factors, one state came out with the best average: Nebraska.

The state had the best economic performance of any in the pandemic up to that point, and its students, according to available data, appear to have suffered little to no learning loss. Whereas many states saw a trade-off between health and wealth in the pandemic — often corresponding to more-restrictive Democratic leadership and less-restrictive Republican leadership, respectively — Nebraska also scored above the national average for health outcomes POLITICO evaluated last year (20th of 50 states). Nebraska was the first state to accumulate a 120-day stockpile of PPE in the nationwide scramble for supplies; was a national leader in opening schools; and was among the quickest getting federal aid to small businesses. As of now, its cumulative pandemic death toll per capita is near the lowest of all 50 states, according to the Kaiser Family Foundation. This, however, is grading on a hideous curve in a country that hasn’t managed the pandemic well in general: More than 4,000 Nebraskans have lost their lives to Covid. Lawler of the University of Nebraska Medical Center, who helped design the state’s early Covid response but has since grown critical of Nebraska’s approach, notes that South Korea has 14 times lower per capita Covid mortality than Nebraska. “Nobody,” he told me via text, “should be patting themselves on the back for doing 14 [times] worse.”

Author(s): Kathy Gilsinan

Publication Date: 22 April 2022

Publication Site: Politico

Bermuda: Living life (insurance) in paradise

Link: https://www.milliman.com/en/insight/bermuda-living-life-insurance-in-paradise/?utm_source=linkedin&utm_medium=social-global-company-page&utm_campaign=life

PDF: https://www.milliman.com/-/media/milliman/pdfs/2022-articles/3-28-22-bermuda.ashx

Graphic:

Description:

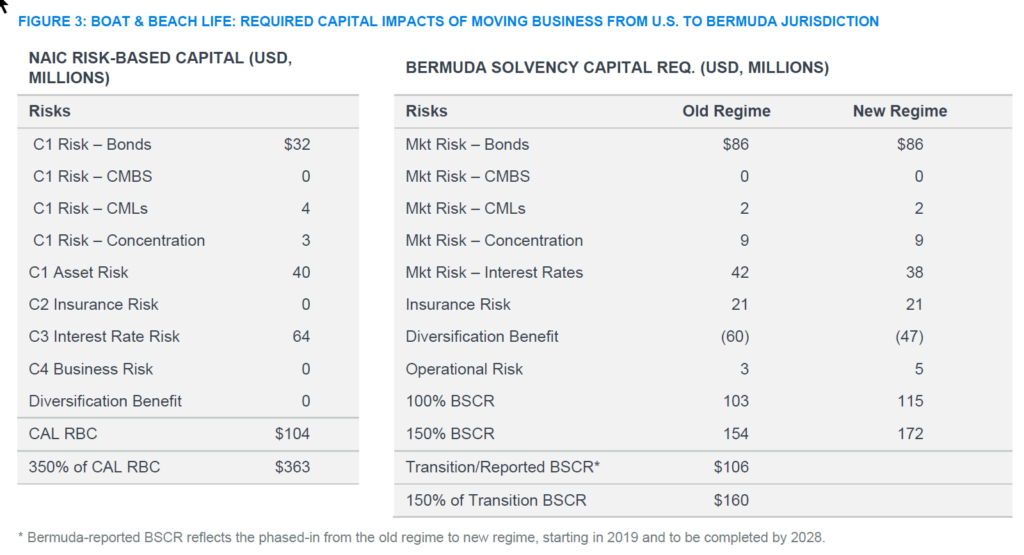
We review the history of life insurance in Bermuda, reflect on how we have gotten to where we are today, and look forward to what may be ahead. We present a hypothetical—yet realistic—case study to illustrate some of the factors that can lead to a strategic decision do business Bermuda. From an embedded-value perspective, we highlight potentially considerable benefits from a move from a U.S. statutory basis to a Bermudian economic balance sheet.

Author(s): Tony Dardis, William C. Hines, and Su Meng Lee

Publication Date: 28 March 2022

Publication Site: Milliman

U.S. Insurer Exposure to Russia, Ukraine, and Oil/Gas Companies Declines from 2020 to 2021

Link: https://content.naic.org/sites/default/files/capital-markets-special-reports-Russia-Ukraine-Oil-Gas-YE2021.pdf

Graphic:

Excerpt:

Total Russian and Ukraine sovereign and corporate debt was $813.3 million at year-end 2021,
representing 97% of total exposure; the remainder comprised $28.8 million in stocks (see Table 2).
While life companies accounted for the majority of the bond exposure at $683.9 million (or 84% of total
Russia and Ukraine bonds), property/casualty (P/C) companies accounted for almost all the Russia and
Ukraine stock exposure at $28 million. About 90% of U.S. insurers’ exposure to Russia and Ukraine
bonds and stocks was held by large companies, or those with more than $10 billion assets under
management.

Author(s): Jennifer Johnson, Michele Wong, Jean-Baptiste Carelus

Publication Date: 14 Apr 2022

Publication Site: NAIC Capital Markets Special Reports

SFA Update – One Revision; One Withdrawal

Link:https://burypensions.wordpress.com/2022/04/15/sfa-update-one-revision-one-withdrawal/

Graphic:

Excerpt:

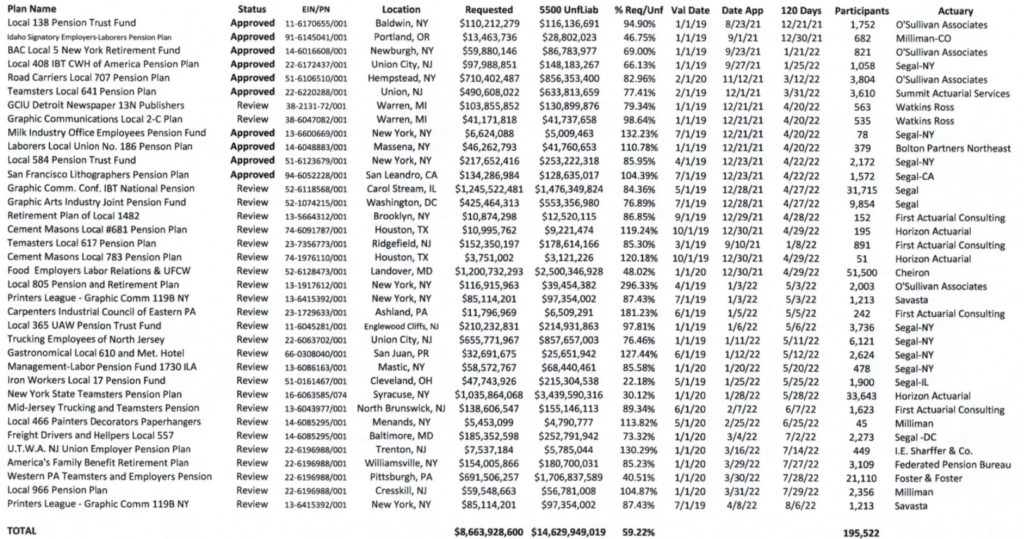
The PBGC Special Financial Assistance program for troubled multiemployer plans weekend update showed one plan withdrawing and reapplying immediately with another simply withdrawing.

Our updated summary of the 35 plans in the system – 10 approvals and 25 under review:

Author(s): John Bury

Publication Date: 15 Apr 2022

Publication Site: Burypensions

2021 U.S. Mortality News Explainer: Life Expectancy, Death Rates, and More

Link:https://marypatcampbell.substack.com/p/2021-us-mortality-news-explainer?s=w

Graphic:

Excerpt:

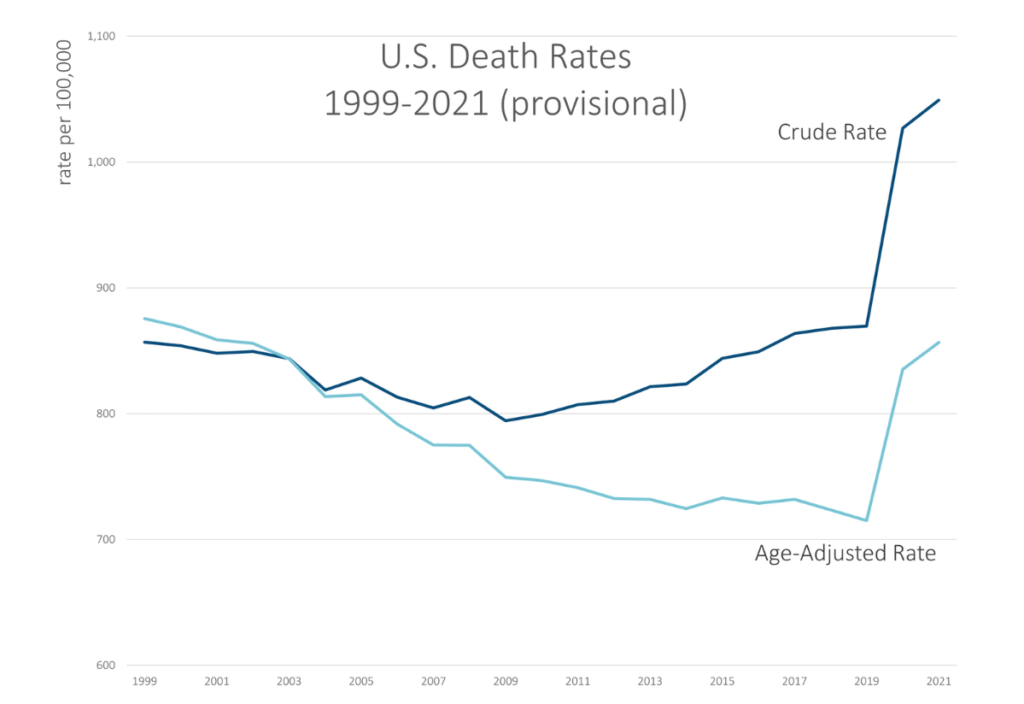
Here’s a graph for 1999 through the provisional 2021 result (as of 3 April 2022 data from CDC WONDER):

You can see the crude rate is higher than the age-adjusted rate for most of the years, and that’s due to the aging of the population. Basically, the Boomers have been getting older, and their older ages (and higher mortality compared to where they were in 2000), have an effect on how many deaths there are overall — thus the crude rate continually increasing as there are more and more old people.

However, until the pandemic hit, the age-adjusted death rate in general decreased, though we had a few years in the 2010s in which the age-adjusted death rate did increase… and yes, that was due to drug overdoses. We will get to that in a bit.

In any case, both the crude rate and age-adjusted rates did jump up by a lot in 2020 due to the pandemic, and COVID deaths were even higher in 2021. But there were other causes of death also keeping mortality rates high in 2021.

I will point out that even with all this extra mortality, the age-adjusted death rate in 2021 is still below where it was in 1999.

That does not mean things are hunky-dory.

This is one of the dangers of collapsing death rates into a single number. The increase in death rates has differed by age group, and it has been far worse for teens and young adults through even young middle-age than it has been for the oldest adults.

Yes, COVID has killed the oldest adults the most, but their death rates have increased the least. It’s all relative.

Author(s): Mary Pat Campbell

Publication Date: 13 Apr 2022

Publication Site: STUMP at substack

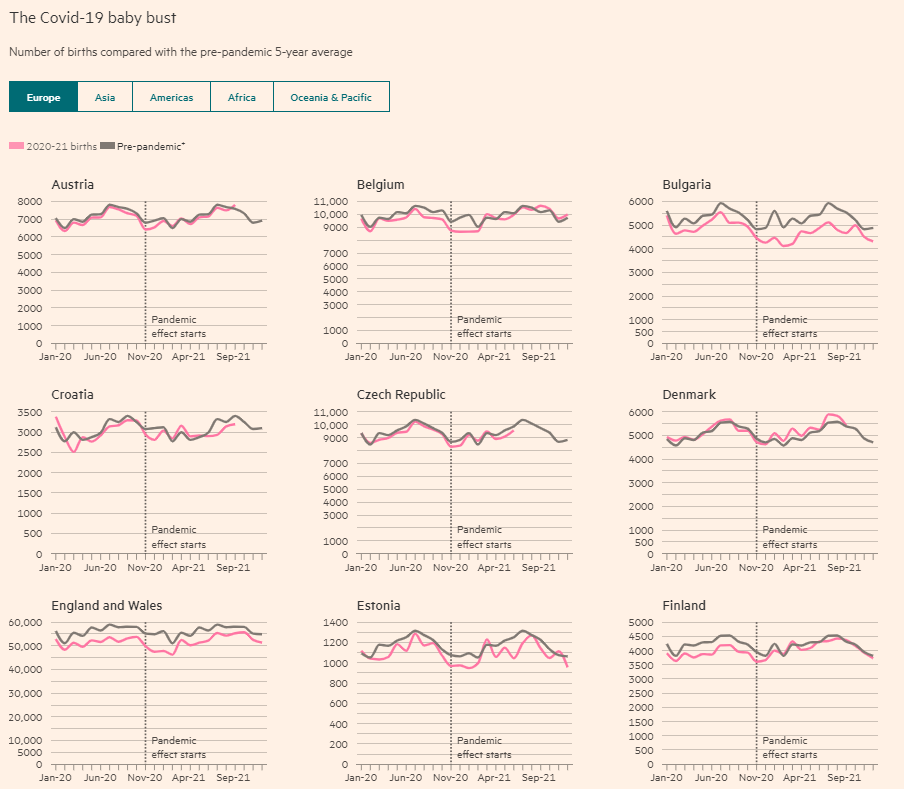
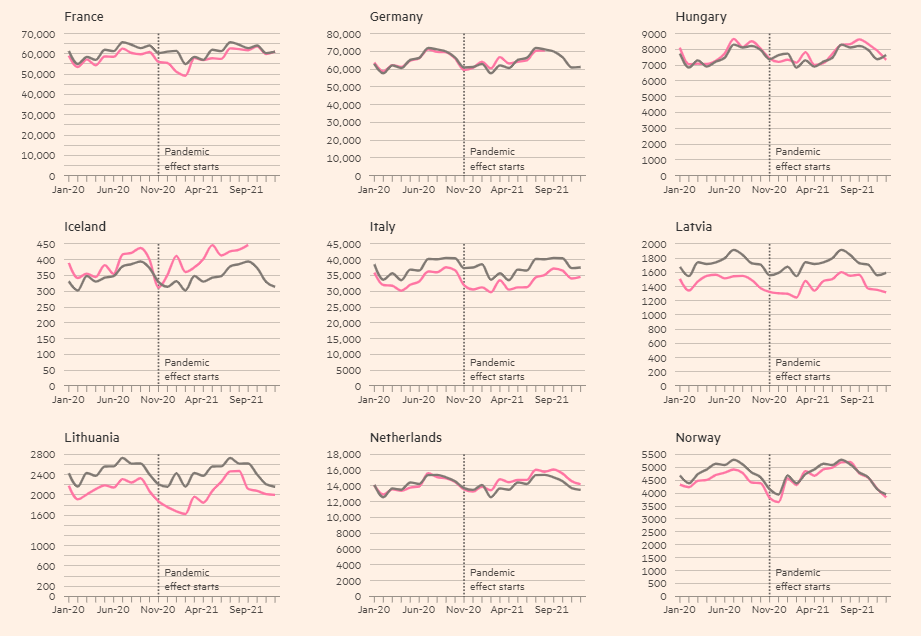
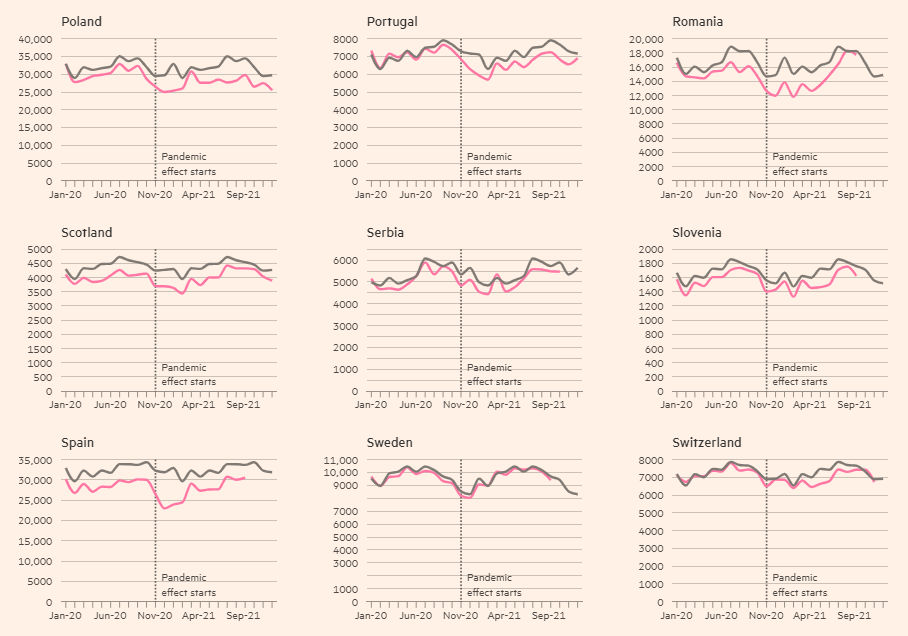
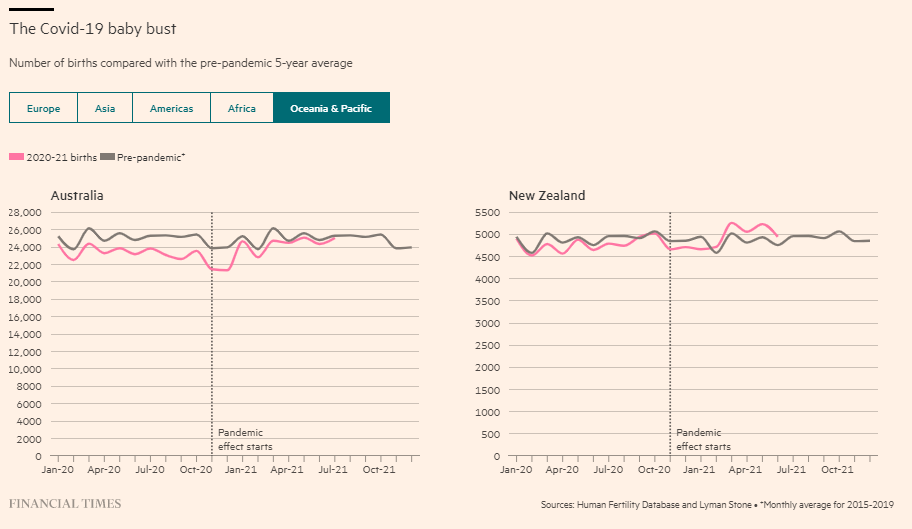
Baby bust: economic stimulus helps births rebound from coronavirus pandemic

Link: https://www.ft.com/content/32436917-00b8-447d-8d6c-41f4be72b03f?accessToken=zwAAAYA7wc2Wkc8yQ2kXALhEfdONbEH0vnKwPw.MEYCIQCFBH5WrakQgRbrgONBrhQRQnrxaYYTg1X8IXTM2IkKsgIhAP6ebnRh2QH5MftGwbJQho_8W3OrJhT_fi3J_mwJO02F&sharetype=gift?token=1738330e-13c3-4b99-8852-a179ac664411

Graphic:

Excerpt:

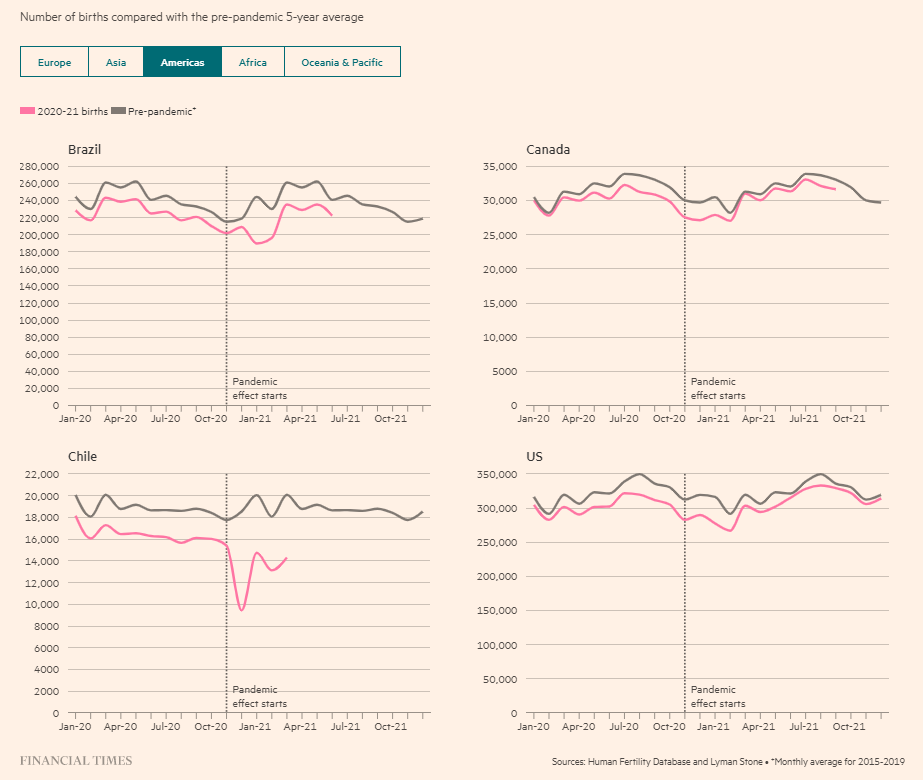
The number of births in advanced economies has largely rebounded to levels before the coronavirus pandemic, a Financial Times analysis shows, a recovery that experts say was partly because of stimulus policies deployed to mitigate the economic impact of the crisis.

Births began to fall sharply in late 2020 after Covid-19 took hold and people were confined to their homes in lockdown, worsening an already perilous demographic trend of population decline in wealthy nations.

The trend mirrored drops during the 1918 flu pandemic, the Great Depression and the global financial crisis in 2008. But an analysis of national data shows a rapid rebound in most developed countries.

…..

The global fertility rate peaked at five in 1960 and has since been in freefall. As a result, demographers believe that, after centuries of booming population growth, the world is on the brink of a natural population decline.

According to a Lancet paper published in 2020, the world’s population will peak at 9.7bn in about 2064, dropping to 8.7bn around the end of the century. About 23 nations can expect their populations to halve by 2100: Japan’s population will fall from a peak of 128mn in 2017 to less than 53mn; Italy’s from 61mn to 28mn.

Low fertility rates set off a chain of economic events. Fewer young people leads to a smaller workforce, hitting tax receipts, pensions and healthcare contributions.

Author(s): Federica Cocco, Lyman Stone

Publication Date: 18 Apr 2022

Publication Site: Financial Times

Preliminary results for 2021 All-Cause U.S. Mortality: 21% More Deaths than 2019, 2% More Deaths than 2020

Link: https://marypatcampbell.substack.com/p/preliminary-results-for-2021-all?s=w

Graphic:

Excerpt:

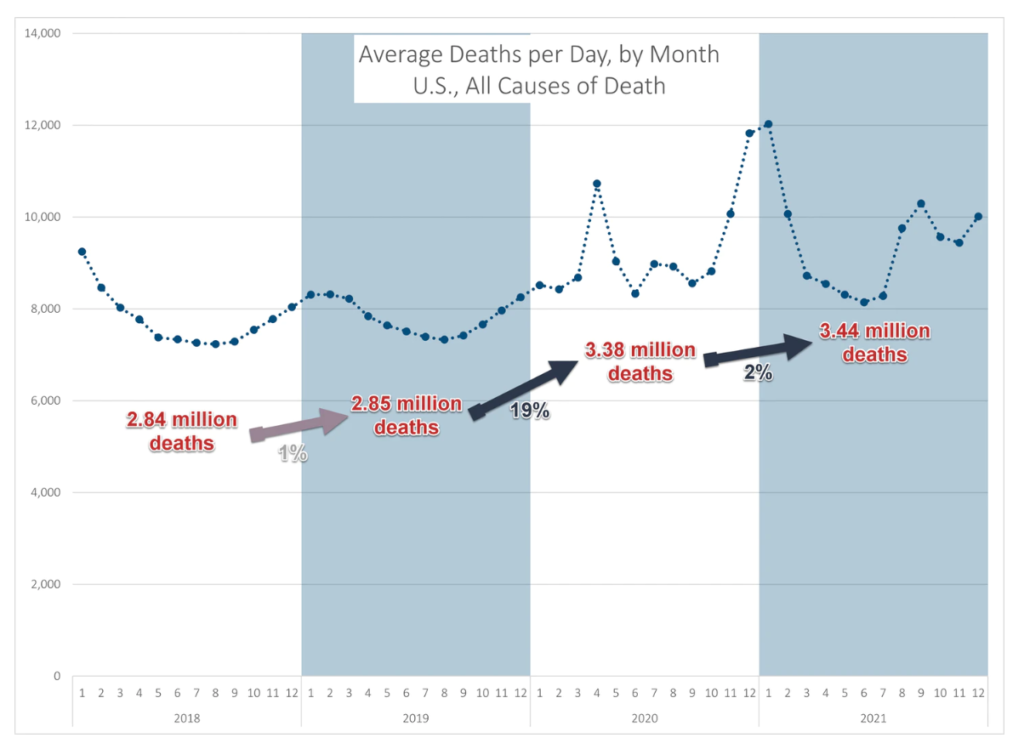
As you can see from the annotation on the graph, so far there have been 2% more deaths reported in 2021 compared to 2020. You can see that there had been a spike of deaths at the beginning of 2021, then a quiet spring/early summer. I did not extend my graph into 2022, but the heightened mortality of later/summer fall into winter has continued into winter at the beginning of 2022.

For the record, the 1% increase in deaths from 2018 to 2019 was pretty common before, driven by regular growth of the aging population of the U.S.

Author(s): Mary Pat Campbell

Publication Date: 3 April 2022

Publication Site: STUMP at substack

Risk-Based Rating in Personal Lines Insurance

Link: https://www.youtube.com/watch?v=IPYSSZkP-Oo&ab_channel=RStreetInstitute

Video:

Description:

The insurance industry is unique in that the cost of its products—insurance policies—is unknown at the time of sale. Insurers calculate the price of their policies with “risk-based rating,” wherein risk factors known to be correlated with the probability of future loss are incorporated into premium calculations. One of these risk factors employed in the rating process for personal automobile and homeowner’s insurance is a credit-based insurance score.

Credit-based insurance scores draw on some elements of the insurance buyer’s credit history. Actuaries have found this score to be strongly correlated with the potential for an insurance claim. The use of credit-based insurance scores by insurers has generated controversy, as some consumer organizations claim incorporating such scores into rating models is inherently discriminatory. R Street’s webinar explores the facts and the history of this issue with two of the most knowledgeable experts on the topic.

Featuring:

[Moderator] Jerry Theodorou, Director, Finance, Insurance & Trade Program, R Street Institute
Roosevelt Mosley, Principal and Consulting Actuary, Pinnacle Actuarial Services
Mory Katz, Legacy Practice Leader, BMS Group

R Street Institute is a nonprofit, nonpartisan, public policy research organization. Our mission is to engage in policy research and outreach to promote free markets and limited, effective government.

We believe free markets work better than the alternatives. We also recognize that the legislative process calls for practical responses to current problems. To that end, our motto is “Free markets. Real solutions.”

We offer research and analysis that advance the goals of a more market-oriented society and an effective, efficient government, with the full realization that progress on the ground tends to be made one inch at a time. In other words, we look for free-market victories on the margin.

Learn more at https://www.rstreet.org/
Follow us on Twitter at @RSI

Author(s): Jerry Theodorou, Roosevelt Mosley, Mory Katz

Publication Date: 4 April 2022

Publication Site: R Street at YouTube

Alcohol-Related Deaths During the COVID-19 Pandemic

Link: https://jamanetwork.com/journals/jama/fullarticle/2790491

Graphic:

Excerpt:

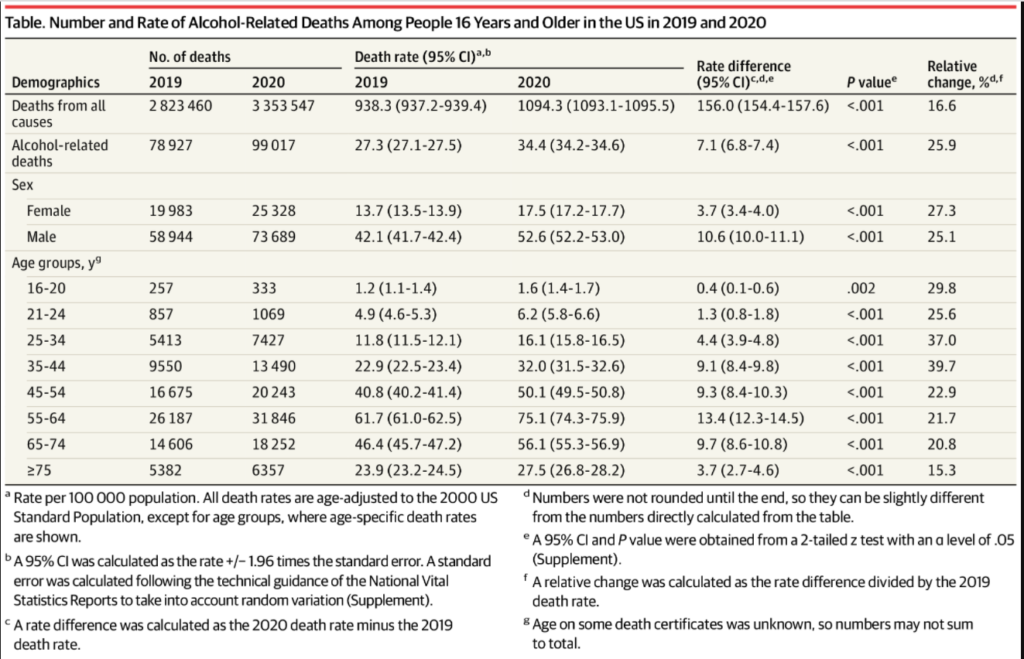
The number of deaths involving alcohol increased between 2019 and 2020 (from 78 927 to 99 017 [relative change, 25.5%]), as did the age-adjusted rate (from 27.3 to 34.4 per 100 000 [relative change, 25.9%]) (Table). Comparatively, deaths from all causes had smaller relative increases in number (from 2 823 460 to 3 353 547 [18.8%]) and rate (from 938.3 to 1094.3 per 100 000 [16.6%]). Alcohol-related deaths accounted for 2.8% of all deaths in 2019 and 3.0% in 2020.

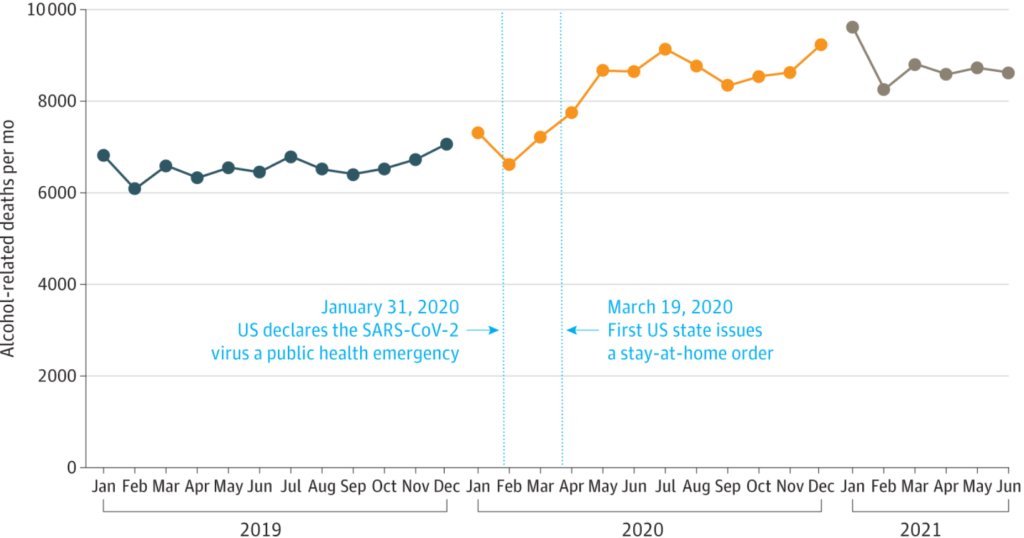
The Figure presents the number of alcohol-related deaths in 2019 and 2020 by month, with provisional data included for the first 6 months of 2021.

Rates increased for all age groups, with the largest increases occurring for people aged 35 to 44 years (from 22.9 to 32.0 per 100 000 [39.7%]) and 25 to 34 years (from 11.8 to 16.1 per 100 000 [37.0%]). Increases in rates were similar for females (from 13.7 to 17.5 per 100 000 [27.3%]) and males (from 42.1 to 52.6 per 100 000 [25.1%]) (Table).

The number of deaths with an underlying cause of alcohol-associated liver diseases increased from 24 106 to 29 504 (22.4%) and the number of deaths with an underlying cause of alcohol-related mental and behavioral disorders increased from 11 261 to 15 211 (35.1%). Opioid overdose deaths involving alcohol as a contributing cause increased from 8503 to 11 969 (40.8%). Deaths in which alcohol contributed to overdoses specifically on synthetic opioids other than methadone (eg, fentanyl) increased from 6302 to 10 032 (59.2%).

Author(s): Aaron M. White, PhD1; I-Jen P. Castle, PhD1; Patricia A. Powell, PhD1; et al

Publication Date: 18 Mar 2022

Publication Site: JAMA Network

THE FIRST ANNUAL CAS ACTUARIAL
TECHNOLOGY SURVEY

Link: https://www.casact.org/sites/default/files/2022-03/CAS-RP_First_Annual_CAS_Actuarial_Technology_Survey.pdf

Graphic:

Excerpt:

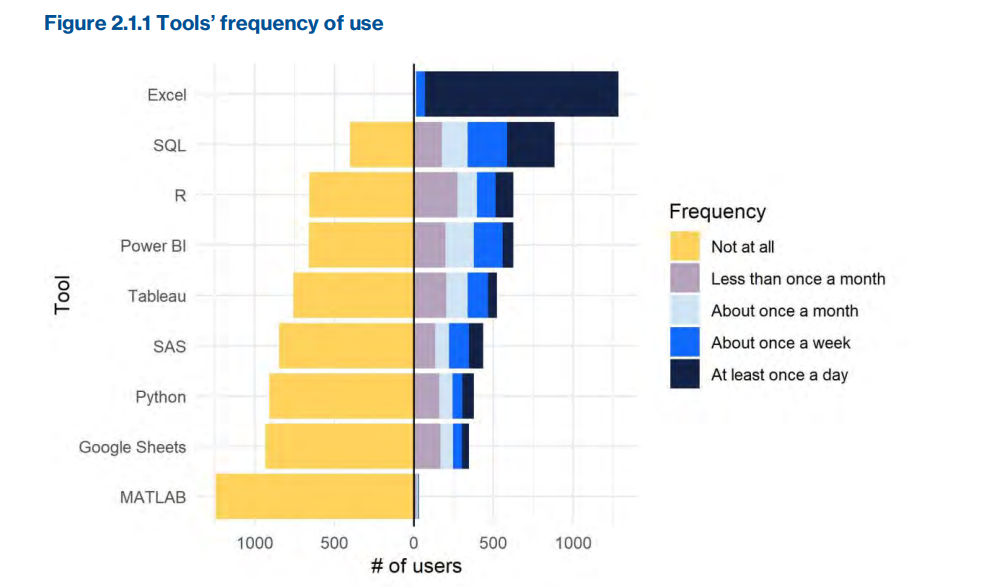
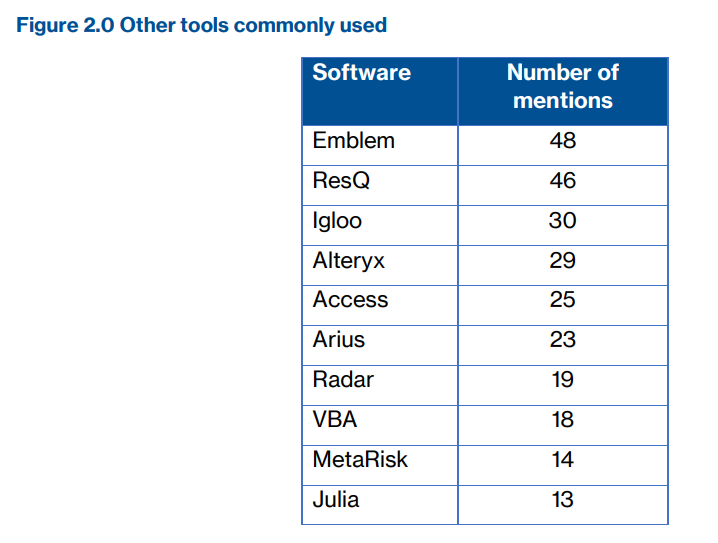
Excel continues to be actuaries’ most widely used software tool, with more than
94.3% of respondents reporting that they use it at least once a day.
• With that understood, most actuaries (92.3%) use more than one tool.
• Actuaries want to increase their proficiency in R (47.2%), Python (39.1%), SQL
(30.8%), and Excel (26.0%).
• No tool had more than 50% of respondents indicating that they wanted to increase
their proficiency.
• Time is the greatest barrier to learning new technology. (80.5% of respondents felt
so.)
• Newer analysis methods such as tree-based algorithms and artificial intelligence (AI)
are not widely used (16.5% and 7.0%, respectively).

Author(s): Casualty Actuarial Society

Publication Date: March 2022

Publication Site: CAS Research Paper

More Americans 65 and Under Died from Alcohol-Related Causes Than Covid-19 in 2020, Study Finds

Link: https://www.nationalreview.com/news/more-americans-65-and-under-died-from-alcohol-related-causes-than-covid-19-in-2020-study-finds/

Excerpt:

Alcohol-related deaths increased 25 percent from 2019 to 2020, with alcohol-related deaths among adults younger than 65 outnumbering deaths from Covid-19 in the same age group in 2020, a new study found.

Alcohol-related deaths, including from liver disease and accidents, increased to 99,017 in 2020, up from 78,927 the year prior, according to the study performed by researchers with the National Institute on Alcohol Abuse and Alcoholism, a division of the National Institutes of Health.

While 74,408 Americans ages 16 to 64 died of alcohol-related causes, 74,075 individuals under 65 died of Covid-19, the study found. The rate of increase for alcohol-related deaths in 2020 (25 percent) was greater than the rate of increase of deaths from all causes (16.6 percent).

The study shows just another unintended consequence of Covid-19 lockdowns and mitigation measures.

Author(s): Brittany Bernstein

Publication Date: 22 March 2022

Publication Site: National Review