New CT budget has an unprecedented built-in surplus of $2.3 billion

Excerpt:

Question: When was the last time a Connecticut legislature was poised to adopt a state budget with a $2.3 billion surplus built into it?

Answer: Never, until now.

Democrats and Republicans alike were expected to vote for the $46.4 billion, two-year package when it goes before the House of Representatives on Tuesday. But even though about 5% of the funds appears to be left unspent, the anticipated surplus would become a payment into the state’s pension accounts.

That’s because the budget, which boosts spending 2.6% in the fiscal year beginning July 1 and by 3.9% in 2022-23, really is the first of its kind under a new system designed to bring stability to state finances.

Connecticut is four years into a savings program that limits spending of income tax receipts tied to capital gains and other investment earnings, but this is the first time since 2017 that analysts are projecting big revenues from Wall Street before legislators actually approve a budget.

Author(s): Keith Phaneuf

Publication Date: 8 June 2021

Publication Site: CT Mirror
Rebekah Jones’s Lies about Florida COVID Data Keep Piling Up

Link: https://www.nationalreview.com/2021/06/rebekah-joness-lies-about-florida-covid-data-keep-piling-up/

Excerpt:

One of the most persistent falsehoods of the COVID pandemic has been the claim that Florida has been “hiding” data. This idea has been advanced primarily by Rebekah Jones, a former Florida Department of Health employee, who, having at first expressed only some modest political disagreements with the way in which Florida responded to COVID, has over time become a fountain of misinformation.

…..

To understand what is happening here, one needs to go back to the beginning. Over the past 15 months, Florida has published a truly remarkable amount of COVID-related data. At the heart of this trove has been a well-maintained list of literally every documented case of COVID — listed by county, age, and gender, and replete with information about whether the patient had recently traveled, had visited the ER, had been hospitalized, and had had any known contact with other Floridians. To my knowledge, Florida has been the only state in the union that has published this kind of data.

…..

To this day, you can download Florida’s case-line data and see 21 cases of COVID that, despite having been identified between March 2020 and December 2020, feature a December 2019 “Event Date.” To anyone who understands data, these results are clearly the product of the system having assigned a non-null default value when no data has been entered. To the Miami Herald, however, these results hinted at scandal. Even now, when its reporters know beyond any doubt that their initial instincts were wrong, the Herald continues to tell its readers that these entries serve as “evidence of community spread potentially months earlier than previously reported.” This is not true.

Author(s): Matt Shapiro

Publication Date: 8 June 2021

Publication Site: National Review

Update to Special Reports on Traffic Safety During the COVID-19 Public Health Emergency: Fourth Quarter Data

Link: https://www.nhtsa.gov/sites/nhtsa.gov/files/2021-06/Update_Traffic%20Safety%20During%20COVID-19_4thQtr-060121-web.pdf

Graphic:

Excerpt:

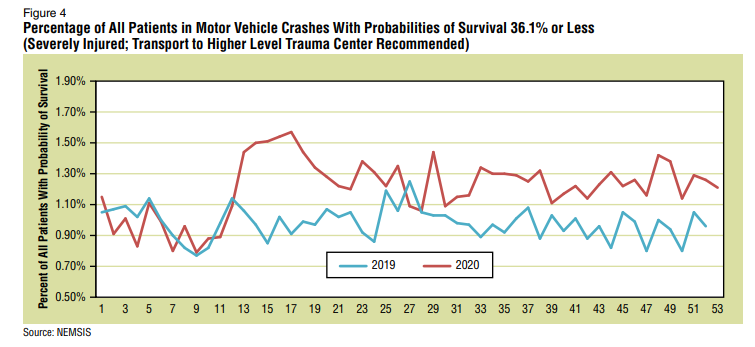
The NEMSIS data include metrics on crash severity. For people treated at the scenes of motor vehicle crashes, EMS professionals use an injury scoring system called the Revised Trauma Score (RTS) to determine the level of care needed to save the lives of the injured. Under
RTS, patients who present with a probability of survival of 36.1% or less are considered severely injured and are often transported to Level 1 or Level 2 trauma centers that provide higher levels of critical care to the most severely injured. Figure 4 shows the percentage of
patients in crashes whose probability of survival was in this range for 2019 and 2020. Beginning in Week 12 of 2020, the percentage of those injured with a probability of survival of 36.1% or less never dropped below 1%, suggesting an increase in the severity of crashes.

Publication Date: June 2021

Publication Site: NHTSA

Early Estimates of Motor Vehicle Traffic Fatalities and Fatality Rate by Sub-Categories in 2020

Link: https://crashstats.nhtsa.dot.gov/Api/Public/ViewPublication/813118

Graphic:

Excerpt:

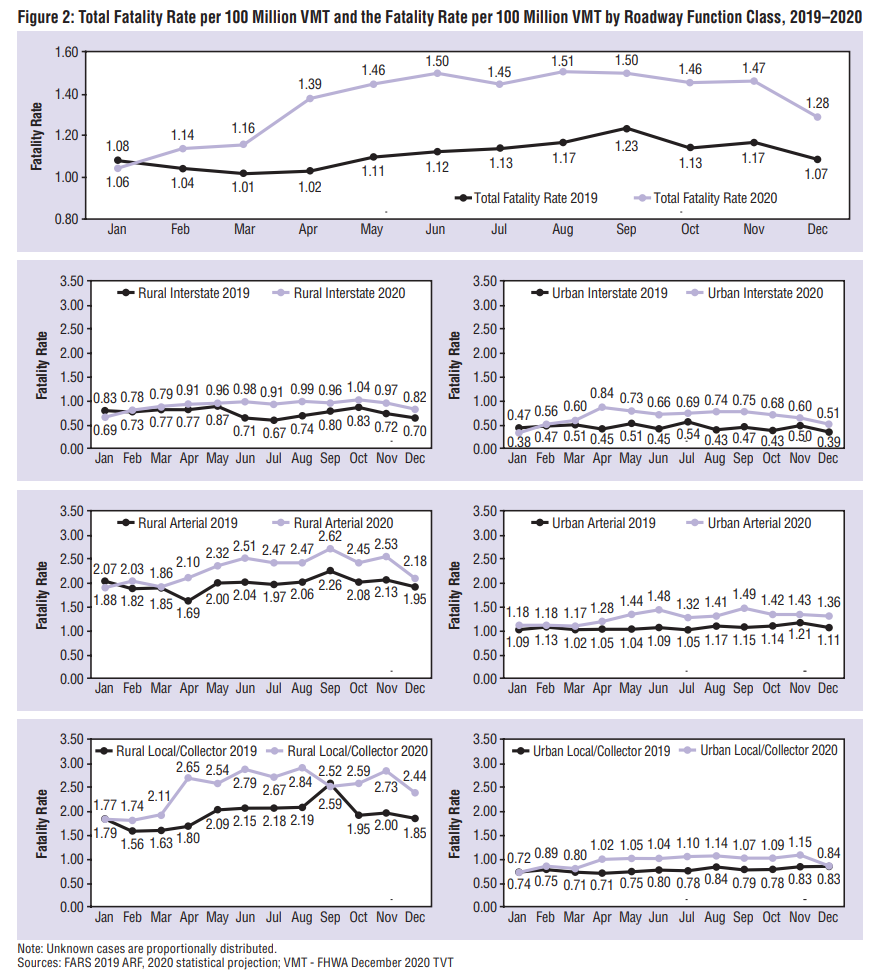
Total fatality rate per 100 million VMT [vehicle miles traveled] is broken down by roadway function class: rural versus urban interstate, arterial, local/collector/street. The results shown in Figure 2 indicate that the increased trend of the total fatality rate per 100 million VMT from March to December 2020, was mainly driven by the fatality rate per 100 million VMT on the rural local/collector/street, rural and urban arterial roadways.

Publication Date: May 2021

Publication Site: NHTSA

2020 Fatality Data Show Increased Traffic Fatalities During Pandemic

Link: https://www.nhtsa.gov/press-releases/2020-fatality-data-show-increased-traffic-fatalities-during-pandemic

Excerpt:

Preliminary finding show that traffic fatalities rose in most major categories over 2019: 

Passenger vehicle occupants (23,395, up 5%)

Pedestrians (6,205, flat from 2019)

Motorcyclists (5,015, up 9%)

Pedalcyclists (people on bikes) (846, up 5%)

Crash factors and demographics reviewed by NHTSA that showed the largest increases in 2020 as compared to 2019 included: 

non-Hispanic Black people (up 23%); 

occupant ejection (up 20%);

unrestrained occupants of passenger vehicles (up 15%);

on urban interstates (up 15%);

on urban local/collector roads (up 12%);

in speeding-related crashes (up 11%);

on rural local/collector roads (up 11%); 

during nighttime (up 11%); 

during the weekend (up 9%); 

in rollover crashes (up 9%); 

in single-vehicle crashes (up 9%) and; 

in police-reported alcohol involvement crashes (up 9%).

There are a few categories that are projected to have decreases in fatalities in 2020. Fatalities in crashes involving a large truck (commercial or non-commercial use) are projected to decline marginally (down 2%).  Fatalities among older persons (65+ years of age) are projected to decline by about 9 percent.

Publication Date: 3 June 2021

Publication Site: National Highway Traffic Safety Administration

The Secret IRS Files: Trove of Never-Before-Seen Records Reveal How the Wealthiest Avoid Income Tax

Link: https://www.propublica.org/article/the-secret-irs-files-trove-of-never-before-seen-records-reveal-how-the-wealthiest-avoid-income-tax

Methodology: https://www.propublica.org/article/how-we-calculated-the-true-tax-rates-of-the-wealthiest

On legality etc: https://www.propublica.org/article/why-we-are-publishing-the-tax-secrets-of-the-001

Graphic:

Excerpt:

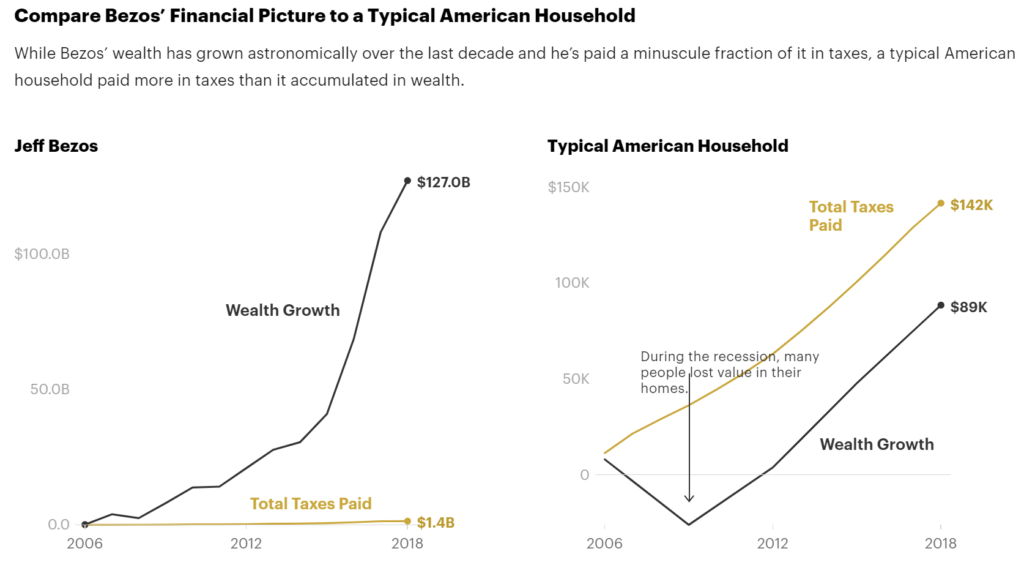
ProPublica has obtained a vast cache of IRS information showing how billionaires like Jeff Bezos, Elon Musk and Warren Buffett pay little in income tax compared to their massive wealth — sometimes, even nothing.

….

In 2011, a year in which his wealth held roughly steady at $18 billion, Bezos filed a tax return reporting he lost money — his income that year was more than offset by investment losses. What’s more, because, according to the tax law, he made so little, he even claimed and received a $4,000 tax credit for his children.

His tax avoidance is even more striking if you examine 2006 to 2018, a period for which ProPublica has complete data. Bezos’ wealth increased by $127 billion, according to Forbes, but he reported a total of $6.5 billion in income. The $1.4 billion he paid in personal federal taxes is a massive number — yet it amounts to a 1.1% true tax rate on the rise in his fortune.

Author(s): Jesse Eisinger, Jeff Ernsthausen, Paul Kiel

Publication Date: 8 June 2021

Publication Site: ProPublica

U.S. Seizes Share of Ransom From Hackers in Colonial Pipeline Attack

Link: https://www.nytimes.com/2021/06/07/us/politics/pipeline-attack.html

Excerpt:

The Justice Department said on Monday that it had seized much of the ransom that a major U.S. pipeline operator had paid last month to a Russian hacking collective, turning the tables on the hackers by reaching into a digital wallet to snatch back millions of dollars in cryptocurrency.

Investigators in recent weeks traced 75 Bitcoins worth more than $4 million that Colonial Pipeline had paid to the hackers as the attack shut down its computer systems, prompting fuel shortages, a spike in gasoline prices and chaos at airlines.

Federal investigators tracked the ransom as it moved through a maze of at least 23 different electronic accounts belonging to DarkSide, the hacking group, before landing in one that a federal judge allowed them to break into, according to law enforcement officials and court documents.

The Justice Department said it seized 63.7 Bitcoins, valued at about $2.3 million. (The value of a Bitcoin has dropped over the past month.)

Author(s): Katie Benner, Nicole Perlroth

Publication Date: 7 June 2021

Publication Site: New York Times

Reforming Health Insurance: Competition Across State Lines

Link: https://www.manhattan-institute.org/reforming-health-insurance-across-states?utm_source=mailchimp&utm_medium=email

Graphic:

Excerpt:

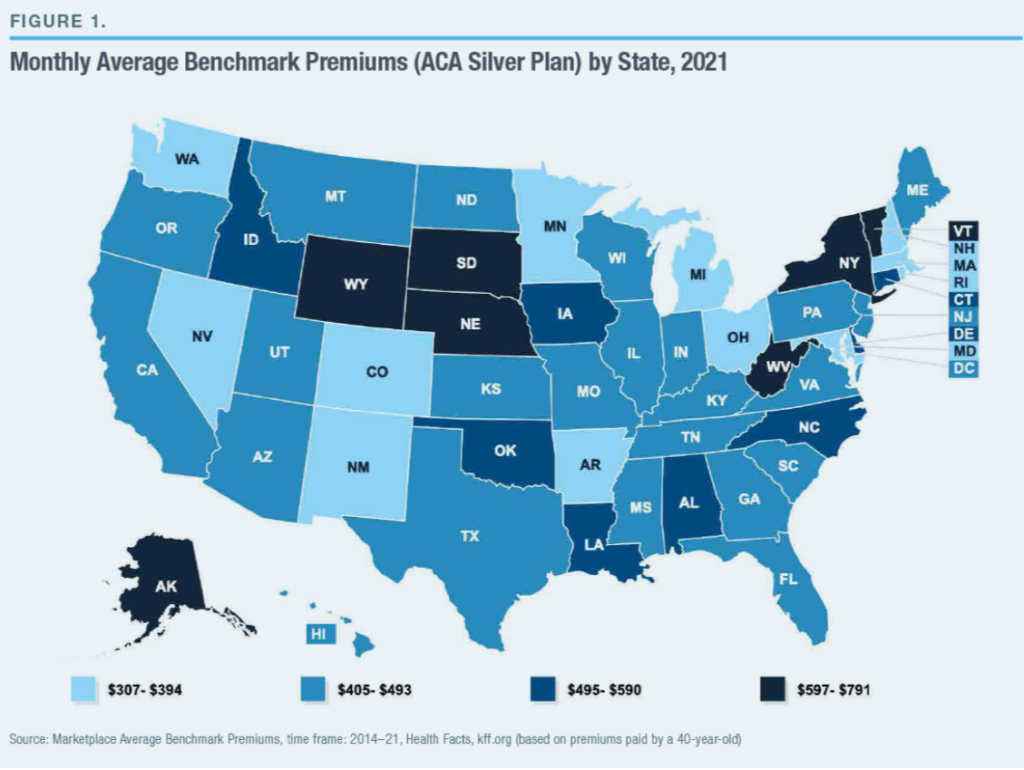
State governments often operate with limited administrative and technical resources and are highly vulnerable to lobbying by interest groups. Medical providers—physicians and hospitals—are well represented in state capitols, and they frequently push legislatures to mandate that insurers pay for services that they provide, as a way to increase the sales (and prices) of these services.

The typical state had fewer than one benefit mandate in 1970; by 2017, the average was 37. James Bailey of Temple University has estimated that each benefit mandate enacted by states tends to increase health-insurance premiums by 0.4%–1.1% and that new mandates were responsible for 9%–23% of premium increases during 1996–2011. Benefit mandates may have added value to insurance coverage by preventing insurers from leaving gaps in coverage, in order to deter sicker individuals from enrolling.[9] Still, in a study of the period 1989–94, Frank Sloan and Christopher Conover of Duke University estimated that 20%–25% of Americans without health insurance were deterred from purchasing coverage because of the added costs resulting from benefit mandates.[10]

Lobbyists for hospitals and physicians have similarly pushed states to enact laws that increase their pricing power, by making it hard for insurers to exclude them from networks of covered providers. When HMOs began to squeeze hospital costs in the late 1990s, more than 1,000 bills were introduced in state legislatures. Most states enacted laws requiring insurers to reimburse “any willing provider” for treatment according to their standard payment arrangements. A study by Maxim Pinkovskiy of the Federal Reserve Bank of New York found that anti-HMO state laws drove up the incomes of medical providers, increased service use, slowed reduction in hospital lengths of stay, and caused U.S. health-care spending to increase by 2% of GDP—accounting for much of the growth in health-insurance costs in the early 2000s.[11]

Author(s): Chris Pope

Publication Date: 8 June 2021

Publication Site: Manhattan Institute

Illinois Budget Leaves Billions in Federal Rescue Funds on the Table

Link: https://www.centerforilpolitics.org/articles/illinois-budget-leaves-billions-in-federal-rescue-funds-on-the-table#new_tab

Excerpt:

The federal government will soon give the cash-strapped state of Illinois $8.1 billion to cope with the fallout from the COVID-19 pandemic, but next year state officials plan to use less than a third of the windfall.

That means that some $5.5 billion in unspent federal cash will remain in state accounts until lawmakers figure out how they want to use it. The state treasurer’s office will invest the money, along with the $38 billion it is already responsible for investing. 

Ironically, Illinois is supposed to get its money faster than many other states because of its urgent need. Most states will get their money from the American Rescue Plan Act in two payments, a year apart. But Illinois is expected to get its full share all at once in the coming months, because it has a high unemployment rate. 

The fact that Illinois is letting so much money sit in the bank, even when it has a long list of pressing financial needs, has a lot to do with the rules the federal government wrote for how states can use the Rescue Act money. 

Author(s): Daniel C. Vock

Publication Date: 6 June 2021

Publication Site: Center for Illinois Politics

2021 Update: Public Plan Funding Improves as Workforce Declines

Full Report: https://crr.bc.edu/wp-content/uploads/2021/06/SLP78.pdf

Graphic:

Excerpt:

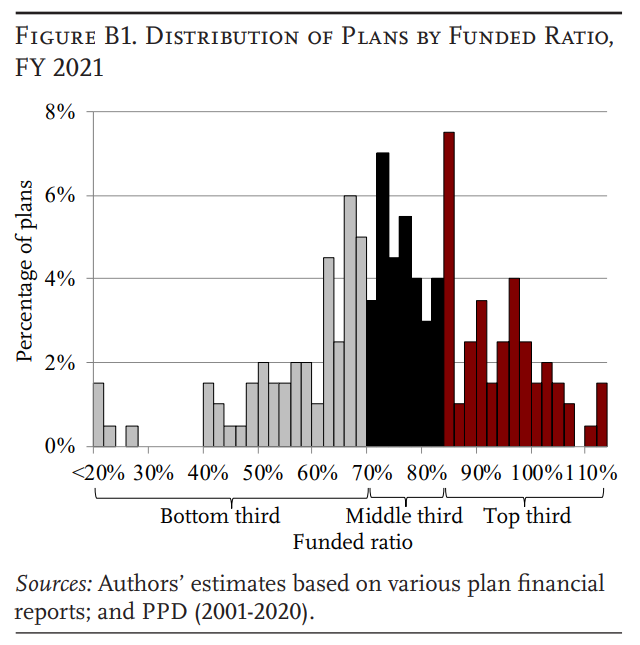
The aggregate funded ratio improved from 73 to 75 percent from FY 2020 to 2021. At the same time, contribution rates rose from 21 to 22 percent of payrolls.

While initial expectations for public pensions were low due to COVID, financial markets rebounded and municipal tax revenues were quite resilient.

Yet one other COVID-related factor – cuts to the state and local workforce – impacted public pension finances in FY 2021.

These cuts had little impact on funded status and required contribution amounts, but they do explain the rise in contribution rates, which are expressed as a share of lower payrolls.

Author(s): Jean-Pierre Aubry, Kevin Wandrei

Publication Date: June 2021

Publication Site: Center for Retirement Research at Boston College

No point vaccinating those who’ve had COVID-19: Findings of Cleveland Clinic study

Link: https://www.news-medical.net/news/20210608/No-point-vaccinating-those-whoe28099ve-had-COVID-19-Findings-of-Cleveland-Clinic-study.aspx

Graphic:

Excerpt:

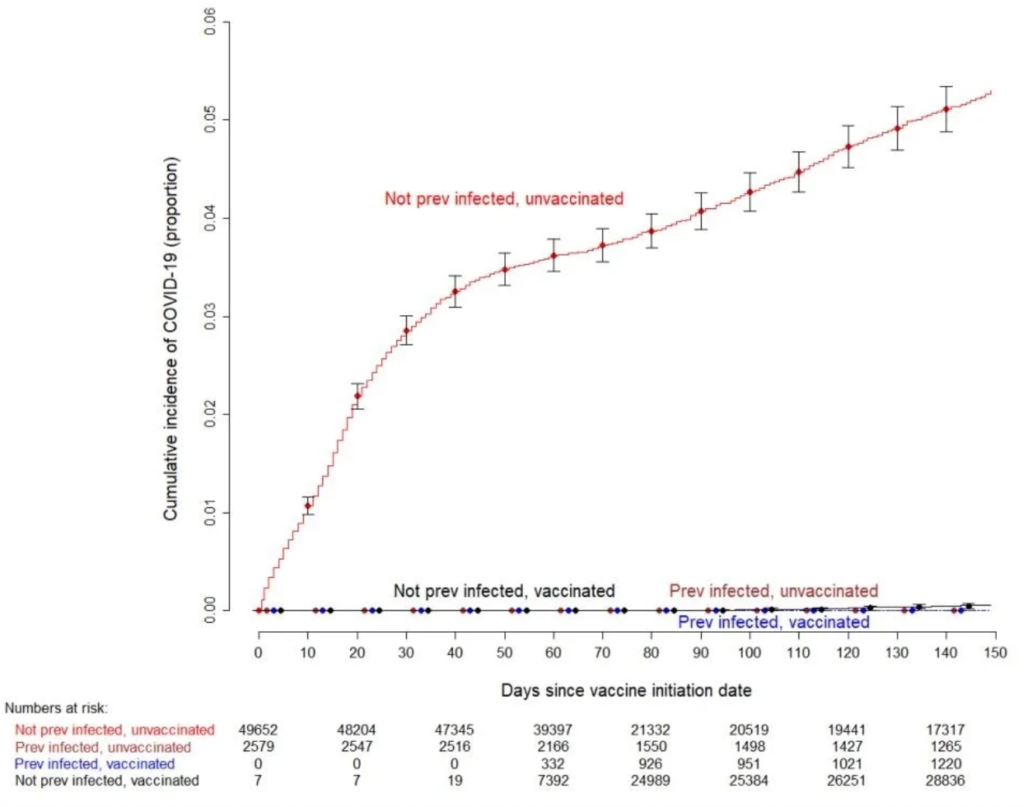
Scientists from the Cleveland Clinic, USA, have recently evaluated the effectiveness of coronavirus disease 2019 COVID-19) vaccination among individuals with or without a history of severe acute respiratory syndrome coronavirus 2 (SARS-CoV-2) infection.

The study findings reveal that individuals with previous SARS-CoV-2 infection do not get additional benefits from vaccination, indicating that COVID-19 vaccines should be prioritized to individuals without prior infection. The study is currently available on the medRxiv* preprint server.

Author(s): Sanchari Sinha Dutta

Publication Date: 8 June 2021

Publication Site: News Medical – Life Sciences

Sovereign Defaults Hit Record in 2020; More Are Possible

Link: https://www.fitchratings.com/research/sovereigns/sovereign-defaults-hit-record-in-2020-more-are-possible-08-06-2021

Graphic:

Excerpt:

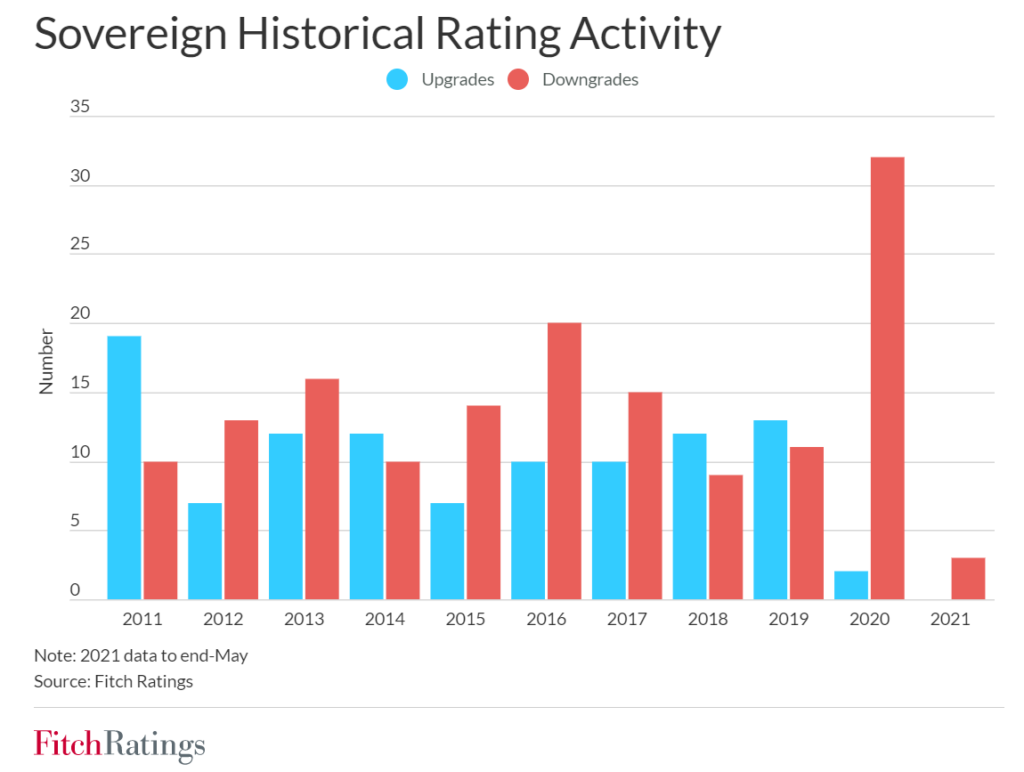
The sovereign issuer-based default rate rose to a record high in 2020 against a backdrop of weakened sovereign credit profiles due to the Covid-19 pandemic, Fitch Ratings says. Downgrade pressures have eased this year, but our ratings indicate that more defaults are possible.

Fitch’s recent Sovereign 2020 Transition and Default Study shows that five Fitch-rated sovereigns defaulted in 2020, up from only one in the previous year. As a result, the sovereign default rate rose more than threefold to 4.2% from 0.9% in 2019. The previous high was 1.8% in both 2016 and 2017.

Publication Date: 8 June 2021

Publication Site: Fitch Ratings