US life expectancy drops a year in pandemic, most since WWII

Link: https://apnews.com/article/us-life-expectancy-huge-decline-f4caaf4555563d09e927f1798136a869

Graphic:

Excerpt:

Life expectancy in the United States dropped a staggering one year during the first half of 2020 as the coronavirus pandemic caused its first wave of deaths, health officials are reporting.

Minorities suffered the biggest impact, with Black Americans losing nearly three years and Hispanics, nearly two years, according to preliminary estimates Thursday from the Centers for Disease Control and Prevention.

“This is a huge decline,” said Robert Anderson, who oversees the numbers for the CDC. “You have to go back to World War II, the 1940s, to find a decline like this.”

Author(s): MARILYNN MARCHIONE

Publication Date: 17 February 2021

Publication Site: Associated Press
COVID-19 Death Rate at VA Nursing Homes Is 13 Times Lower Than National Average

Link: https://www.military.com/daily-news/2021/02/10/covid-19-death-rate-va-nursing-homes-13-times-lower-national-average.html

Excerpt:

If you’re in a nursing home operated by the Department of Veterans Affairs, data shows you’re about half as likely to contract COVID-19 as you are in a non-VA senior living facility, and 13 times less likely to die from the disease.

In the past year, 1,679 residents of VA nursing homes, which it calls community living centers or CLCs, contracted COVID-19, and 143 died “within 30 days after a positive test,” according to the department.

With more than 30,000 American veterans living in these facilities, that translates to an infection rate of 5.47 per 100 people and a death rate of less than .5%.

Author(s): Patricia Kime

Publication Date: 10 February 2021

Publication Site: Military.com

Perspective: Did National Health Spending in 2020 Decline for the First Year in Recorded History? Preliminary Data Say It Did

Link: https://altarum.org/news/did-national-health-spending-2020-decline-first-year-recorded-history-preliminary-data-say-it

Graphic:

Excerpt:

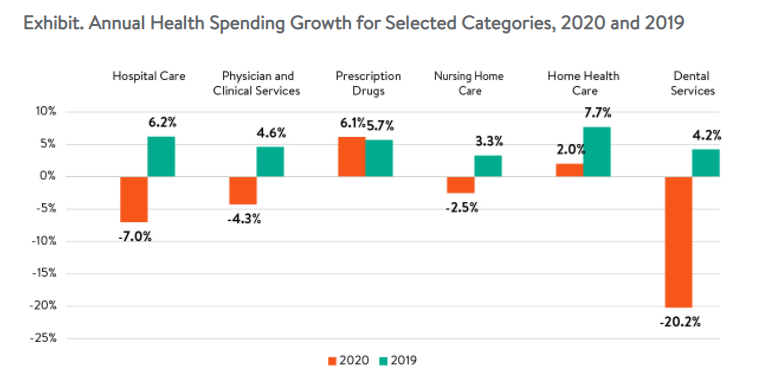
For the first year since at least 1960 – when the Centers for Medicare and Medicaid Services (CMS) began tracking national health expenditures – total health spending in 2020 was less than in the previous year. While spending has recovered somewhat from its pandemic-related decline in the spring, our preliminary estimate is that national health spending in 2020 was 2.0% lower than in 2019, a decline of about $75.8 billion dollars. The exhibit shows annual growth rates for six major personal health care components of health spending in 2020 and, for comparison, 2019. The latter numbers match the CMS National Health Expenditure Accounts (NHEA) for 2019, while the 2020 values are based primarily on the latest BEA data, adjusted to match more nearly those that would be produced by CMS.

Author(s): George Miller, Corwin (Corey) Rhyan, Ani Turner

Publication Date: 17 February 2021

Publication Site: Altarum

SEC Sues Morningstar’s Former Credit Ratings Agency

Link: https://www.thinkadvisor.com/2021/02/17/sec-sues-morningstars-former-credit-ratings-agency/

Excerpt:

In a rebuke to the SEC lawsuit, Morningstar issued a press release on Feb. 17, saying that MCR “complied with the regulatory requirements in question” while the SEC’s position is “inconsistent with its own rules and … policies” and that the agency has “overstepped its regulatory limitations by imposing requirements that would regulate the substance of credit rating methodologies.”

In an accompanying position paper, Morningstar said that by questioning MCR’s use of qualitative factors in its legacy CMBS ratings model, the SEC is “attempting to dictate the substance of MCR’s rating methodology,” which it is prohibited to do by law. “If the SEC believes additional rules are required — consistent with the analytical independence of a credit rating agency — the agency should go through the rule-making process, not file an action against MCR.”

Author(s): Bernice Napach

Publication Date: 17 February 2021

Publication Site: Think Advisor

How Biden’s ‘Donut Hole’ Plan Could Undermine Social Security

Link: https://www.thinkadvisor.com/2021/02/17/how-bidens-donut-hole-plan-could-undermine-social-security/

Excerpt:

But Richard Johnson, director of the Urban Institute’s Program on Retirement Policy, argues that he has a better idea — one that would generate more tax revenue for Social Security benefits without creating a donut hole, he tells ThinkAdvisor in an interview.

“Increase the $142,800 tax max to something like $250,000 today and continue to raise it [based on] average earnings growth,” he recommends.

Part of Johnson’s reasoning is rooted in the presumption that if Social Security were to be perceived as only for low-income earners, political support for the crucial program would be diminished.

Author(s): Jane Wollman Rusoff

Publication Date:

Publication Site: Think Advisor

NAIC Reveals 5 Regulatory Priorities for 2021

Link: https://insurance-forums.com/health/long-term-care/naic-reveals-5-regulatory-priorities-for-2021/

Excerpt:

Race & Insurance — The insurance regulatory system, and insurance in general, reflects the society it protects. Through our special committee on race and insurance we will continue to ensure the availability and affordability of insurance products for persons of color and historically underrepresented groups and promote diversity and inclusion within our sector.

Climate Risk & Resiliency — The NAIC is committed to working with state, federal and international stakeholders to coordinate climate-related risk and resiliency assessments, disclosures, and evaluation initiatives so that each state has the information, policies, and tools that promote resiliency and ensure stable insurance markets for its citizens.

Author(s): Insurance Forums Staff

Publication Date: 17 February 2021

Publication Site: Insurance Forums

Officials Struggle With Conflicting Vaccine Priorities

Link: https://www.governing.com/now/Officials-Struggle-With-Conflicting-Vaccine-Priorities.html

Excerpt:

Though the nation’s vaccine availability will probably improve substantially in the coming months, officials at this moment are wading through what could be the most contentious phase of the rollout — a collision of relentless demand and constrained supply. “We’ve got to take care of the most vulnerable,” California Gov. Gavin Newsom said at a recent news briefing when asked about priority for individuals with disabilities and underlying conditions.

….

At the heart of the debate around how to allocate vaccines is a conundrum: Should scarce vaccine be given to one young person, say a supermarket cashier who interacts with hundreds of people a day, because that may protect five elderly people from being infected? Or should the vaccines go directly to five elderly people?

Author(s): SOUMYA KARLAMANGLA AND COLLEEN SHALBY, LOS ANGELES TIMES

Publication Date: 26 February 2021

Publication Site: Governing

Vaccine Efficacy, Statistical Power and Mental Models

Link: https://zeynep.substack.com/p/vaccine-efficacy-statistical-power

Excerpt:

 If that’s what the vaccine trials were measuring—the height of thewall that is our immune system comparing vaccine effectiveness would make a lot of sense.  Many high-profile, highly-credentialed people have been (misleadingly) describing it exactly in that manner: that if a vaccine is 95% effective, those 5% are left “unprotected.” If Moderna and Pfizer and 95% efficacious, and if Johnson and Johnson is 66%—well, that would mean that 34% of the people are left “unprotected.” right?

Wrong. To get to why that assumption is not right—and why those vaccine efficacy numbers are not the height of the wall that represents the immune system—let me first mention something important The two mRNA vaccines do appear to be spectacular, but they were tested under conditions where those pesky “variants-of-concern”—the B.117 (UK one) and B. 1.351 (South Africa) and P1–were not widespread. If tested now, under equal conditions, those numbers may be closer. Plus, Johnson & Johnson is a single-shot with a trial with a booster underway. So those efficacy numbers may well be much closer in reality than they appear from the trial results. But let’s leave that aside for a moment.

Author(s): Zeynep Tufekci

Publication Date: 2 March 2021

Publication Site: Insight on Substack

Kansas Lawmakers Already Have Plans for COVID Relief Funds

Link: https://www.governing.com/finance/Kansas-Lawmakers-Already-Have-Plans-for-COVID-Relief-Funds.html

Excerpt:

Republican lawmakers are eyeing the relief dollars to fund $500 million in tax cuts, heavily targeted to multinational corporations and wealthy and retired Kansans. They also want the money for refunds to students relegated to online learning and replenishment of the state’s unemployment insurance fund, which has been depleted by a record volume of legitimate and fraudulent claims. A House committee on Thursday recommended using the federal aid to fund $500 bonuses for teachers and grants for school security.

The state Senate approved the tax cut earlier this month after growing its size from a proposed $175 million to an estimated $500 million. Though the House has not yet picked up the measure, Senate Republicans have pitched federal dollars as a way to keep it alive.

Senate Majority Leader, Gene Sullentrop, a Wichita Republican, said immediately after the vote that the final size of the cut would be dependent on federal funding.

Author(s): KATIE BERNARD, THE KANSAS CITY STAR

Publication Date: 1 March 2021

Publication Site: Governing

The Importance of How we See the Numbers During the Pandemic

Link: https://idsc.miami.edu/the-importance-of-how-we-see-the-numbers-during-the-pandemic/

Excerpt:

Speaking to Al Jazeera English for a piece entitled: “The Power and Politics of Data Visualisation” three contributors looked at how data is often presented as objective truth, but the way it is presented, interpreted, and contextualized can distort its original purpose. Turning data into graphics people can understand is increasingly important, but viewers also should also be better informed and more careful in recognizing the nature of uncertainty in these visualizations.

The piece looks at how important it is to be able to trust the data, yet it’s equally important that viewers understand that the visualization of the data can be influenced by human decisions on the collection, interpretation, and depiction of the data.  Dr. Cairo says “Data visualizations are some of the best tools that we have to understand the world if we use them well and we interpret them well, but that doesn’t mean that those numbers are the whole story. We also need to use logic and scientific reasoning.”

Publication Date: 26 February 2021

Publication Site: Institute for Data Science & Computing at University of Miami

Reflecting on a decade of data science and the future of visualization tools

Link: https://www.tableau.com/about/blog/2021/2/data-science-and-future-visualization-tools-reflection

Graphic:

Excerpt:

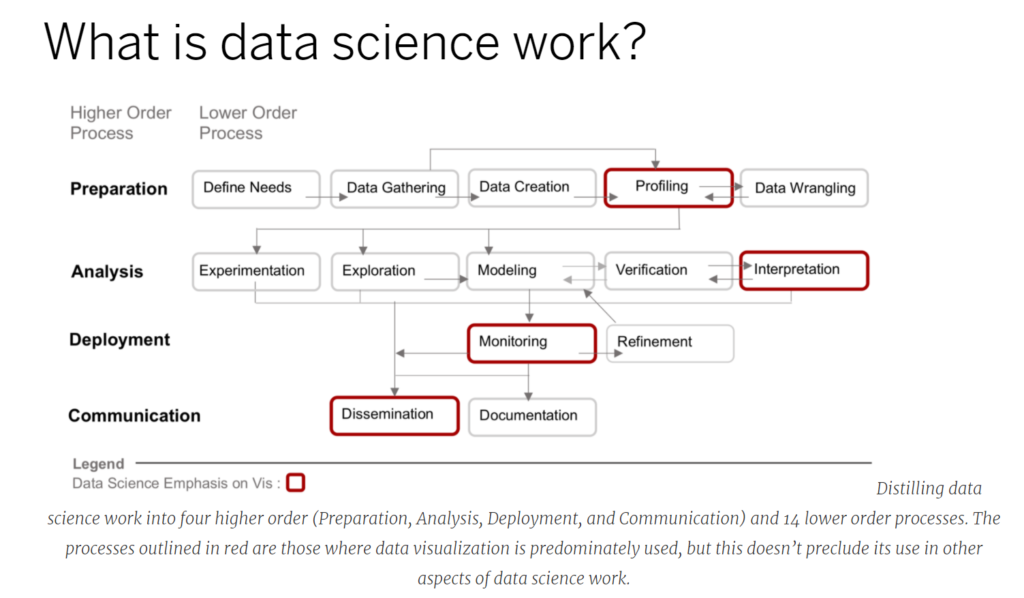
Importantly, a working definition of data science narrows the scope of research. Instead of considering all possible types of data analysis that one may wish to conduct, we look closely at the types of analyses data scientists carry out. This distinction is important as the specific steps that, say, an experimental physicist takes to analyze data are different, even though they share commonalities, than the analytic steps a data scientist may take. Which leads to an important follow on: what exactly is data science work?

There have been several industry standards for breaking down data science work. The first was the KDD (or Knowledge in Data Discovery) method, that over time was modified and expanded upon by others. From these derivations, as well as studies that interview data scientists, we created a framework that has four higher order processes (preparation, analysis, deployment, and communication) and 14 lower order processes. Using the red stroke outline we also highlighted the specific areas where data visualization already plays a prominent role in data science work. In our research article we provide detailed definitions and examples of these processes.

Author(s): ANA CRISAN

Publication Date: 24 February 2021

Publication Site: Tableau

Three ways to make your charts more accessible

Link: https://flourish.studio/2021/03/01/accessible-chart-design/

Graphic:

Excerpt:

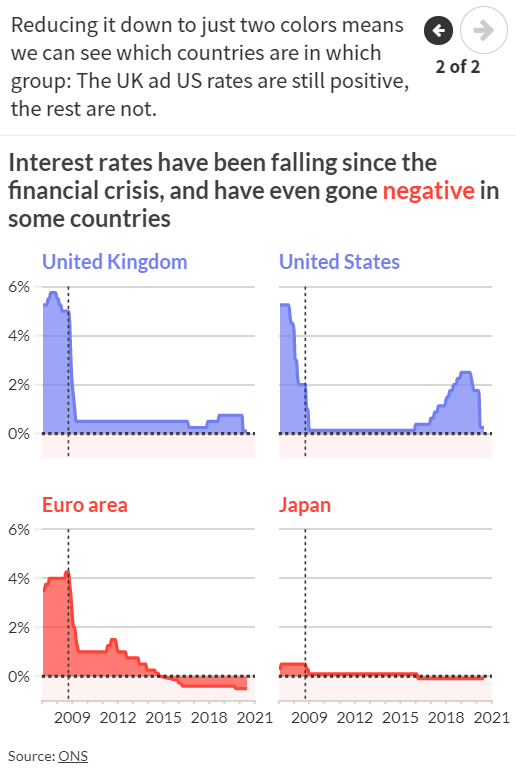
Where possible, use colors that are bold and clear enough for people to see both text and graphical elements, like lines and points. The Web Content Accessibility Guidelines (WCAG) suggest meeting the WCAG AA requirements – something that is required by law for public bodies in several countries.

To check if your color (and font size) choices are AA accessible you can use a contrast checker website. Here you can check if there is enough contrast between the foreground and background colour for someone with a certain level of impaired vision to be able to see your data or text.

Author(s): Lyndsey Pereira-Brereton, Luisa Bider

Publication Date: 1 March 2021

Publication Site: Flourish