Link: https://www.osc.ct.gov/rbsd/reports/index.html
Date Accessed: 27 February 2021
Publication Site: Office of the Connecticut State Comptroller
All about risk
Link: https://www.osc.ct.gov/rbsd/reports/index.html
Date Accessed: 27 February 2021
Publication Site: Office of the Connecticut State Comptroller
Link: https://www.osc.ct.gov/rbsd/reports/indexarchives.html
Date Accessed: 27 February 2021
Publication Site: Office of the State Comptroller
Link: https://www.census.gov/data/academy/webinars.html
Date Accessed: 27 February 2021
Publication Site: U.S. Census Bureau
Link: https://www.census.gov/data/academy/courses/excel.html
Excel is a very popular tool among all data users. It can be leveraged to unlock the value of open data of all kinds, and it is particularly well-suited to transforming, analyzing, and visualizing Census data. This course will show how to use Excel to access, manipulate, and visualize Census data. It will also tools for doing advanced statistical analysis.
After completing this course, you will be able to:
✓ Access data from the Census Bureau using the American FactFinder
✓ Format tables for data analysis
✓ Perform basic and advanced analysis of Census data using Excel
✓ Create data visualizations such as sparklines, hierarchical charts, and histograms
Author(s): Andy Hecktman, Alexandra Barker
Date Accessed: 27 February 2021
Publication Site: U.S. Census Bureau
Link: https://www.census.gov/programs-surveys/qtax.html
Description:
The Quarterly Summary of State and Local Government Tax Revenue provides quarterly estimates of state and local government tax revenue at a national level, as well as detailed tax revenue data for individual states.
Date Accessed: 27 February 2021
Publication Site: U.S. Census Bureau
Link: https://www.burns-stat.com/pages/Tutor/R_inferno.pdf
Graphic:
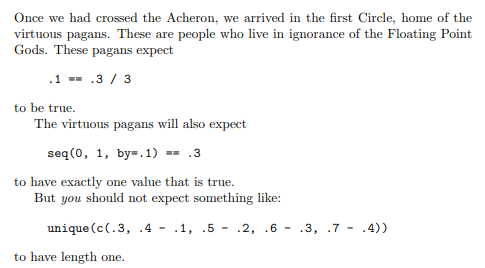
Abstract: If you are using R and you think you’re in hell, this is a map for
you.
Excerpt:
I wandered through
http://www.r-project.org.To state the good I found there, I’ll also say what else I saw.
Having abandoned the true way, I fell into a deep sleep and awoke in a deep dark wood. I set out to escape the wood, but my path was blocked by a lion. As I fled to lower ground, a figure appeared before me. “Have mercy on me, whatever you are,” I cried, “whether shade or living human.”
Author(s): Patrick Burns
Publication Date: 30 April 2011
Publication Site: Burns Statistics
Graphic:
Excerpt:
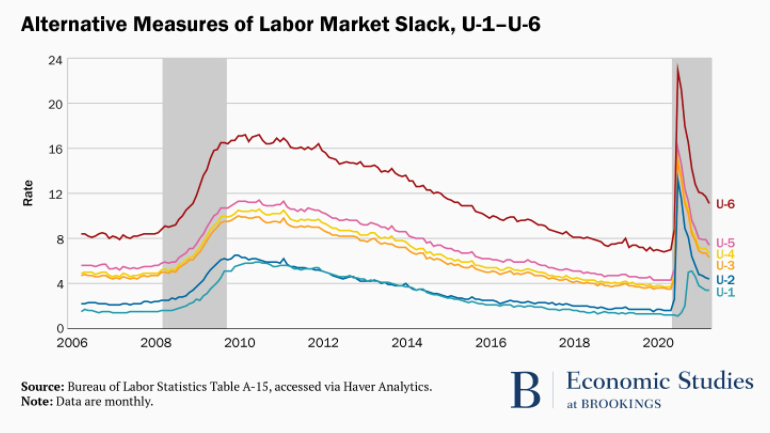
The BLS releases six measures of labor market slack in the monthly jobs report. These include the official unemployment rate (U-3), discussed above, as well as more narrow definitions, called U-1 and U-2, which respectively include only those unemployed at least 15 weeks (the long-term unemployed) or for less than a month (the short-term unemployed). The BLS also publishes broader definitions of slack. The U-6 rate, for instance, counts all those who are technically unemployed plus those are who are working part-time but would prefer full time work, and those “marginally attached to the labor force,” that is, people who say they want either a full-time or part-time job, have not looked for work in the most recent four weeks, but have looked for a job sometime in the past 12 months. When adults classified as “marginally attached” report that they did not recently seek work because they do not believe jobs are available for them, they are classified as “discouraged workers.” The U-4 counts the unemployed and discouraged workers, while U-5 adds in other marginally attached workers. In January, the broadest of these measures, U-6, stood at 11.1 percent, 4.8 percentage points higher than the official unemployment rate.
Author(s): Stephanie Aaronson
Publication Date: 18 February 2021
Publication Site: Brookings
Graphic:
Excerpt:
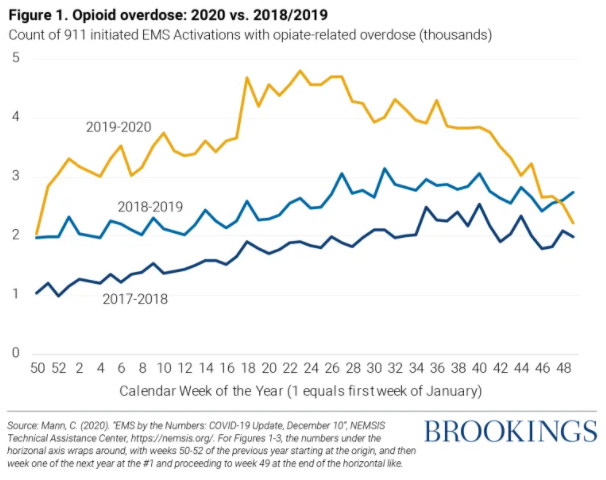
The results that we have to date are stark. New first responder data from the National EMS Information System (NEMSIS) shows significant increases in mental distress, overdose rates, and suicides. Mental health and overdose calls to first responders have doubled in 2020 compared to both 2018 and 2019 (Figures 1-2). Suicides have seen an uptick also, but at a lower rate (Figure 3)
Author(s): Carol Graham
Publication Date: 10 February 2021
Publication Site: Brookings
Graphic:
Excerpt:
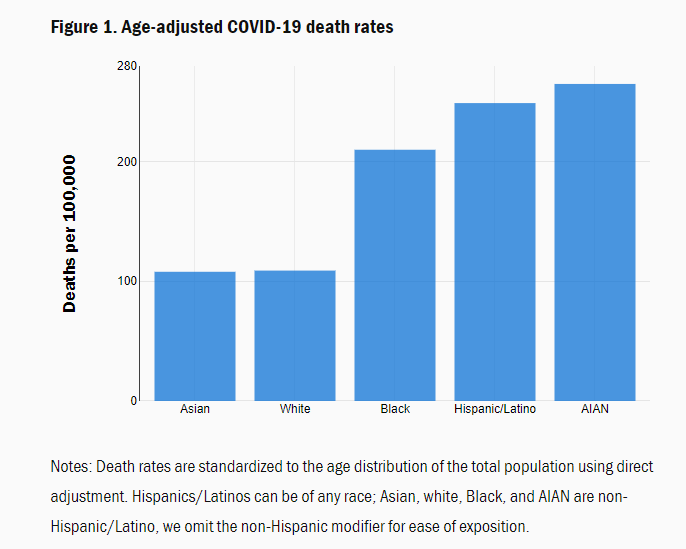
According to Centers for Disease Control (CDC) data, the age-adjusted COVID-19 mortality rate is now higher for AIAN people than for any other group (Figure 1); it is almost two and a half times the death rate for whites and Asians.[2] Figure 1 also shows that the disparities for Blacks and Hispanics/Latinos relative to whites, that we identified in June, remain substantial.[3] (That post also explains why it is important to adjust for age when comparing across groups.)
Author(s): Randall Akee and Sarah Reber
Publication Date: 18 February 2021
Publication Site: Brookings
Link: https://www.ai-cio.com/news/multiemployer-pensions-reach-highest-funding-levels-13-years/?
Excerpt:
Robust investment returns helped boost the aggregate funded percentage of all US multiemployer pension plans to 88% at the end of 2020, from 85% a year earlier—the highest since before the global financial crisis at the end of 2007—according to consulting and actuarial firm Milliman.
The strong performance came despite a turbulent year of market volatility due to the impact of the COVID-19 pandemic. The volatility caused those same plans’ funded ratio to plunge to 72% during the first quarter of the year, which was the largest quarterly drop in funded percentage since 2007. That was followed by a rebound to 82% in the second quarter, which was the largest quarterly increase in funded percentage since 2007.
Author(s): Michael Katz
Publication Date: 22 February 2021
Publication Site: ai-CIO
Excerpt:
Gov. Ned Lamont said Monday he is throwing out the state’s current playbook for the COVID-19 vaccine rollout – which had prioritized people with underlying medical conditions and certain types of workers, such as grocery store and agricultural employees – and is shifting to a system that is strictly age-based, with the next round of shots open to people who are 55 to 64 beginning March 1.
The announcement came just as the state was supposed to open up the next round of vaccines to “essential workers” such as teachers and other school staff, grocery store employees and transportation workers, as well as people 16 and older who have underlying health conditions like heart disease and diabetes.
State officials said teachers and others who work in the schools will still be prioritized in the coming weeks, with special clinics devoted just to those employees. Schools staff is expected to become eligible beginning March 1, with a goal of giving all workers who want a shot access to a first dose by late March.
Author(s): JENNA CARLESSO and KEITH M. PHANEUF
Publication Date: 22 February 2021
Publication Site: CT Mirror
Link: https://www.medrxiv.org/content/10.1101/2021.01.21.21250266v1.full.pdf
Graphic:
Excerpt:
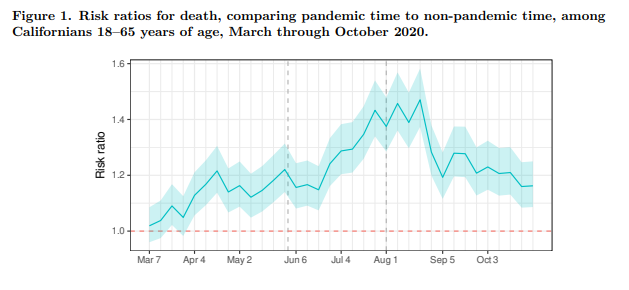
Certain occupational sectors have been associated with high excess mortality during the pandemic, particularly among racial and ethnic groups also disproportionately affected by COVID-19. In-person essential work is a likely venue of transmission of coronavirus infection and must be addressed through strict enforcement of health orders in workplace settings and protection of in-person workers. Vaccine distribution prioritizing in-person essential workers will be important for reducing excess COVID mortality.
Author(s): Yea-Hung Chen, Maria Glymour, Alicia Riley, John Balmes, Kate Duchowny, Robert Harrison, Ellicott Matthay, Kirsten Bibbins-Domingo
Publication Date: 22 January 2021
Publication Site: MedrXiv