Naked Shorting is Illegal: So How the Hell was GameStop 140% Short?

Link: https://www.thestreet.com/mishtalk/economics/naked-shorting-is-illegal-so-how-was-gamestop-140-short

Graphic:

Excerpt:

It is illegal to be naked short in excess of float except for market makers who have to take the other side of a trade.

It was not the market makers who were naked short. It could be in theory, but not in this case, at least not yet.

Hedge funds wanted to short and they have to borrow stocks to do so.

The hedge funds get those shares from somewhere. Where? The brokerages and the market makers such as Goldman Sachs.

It should be the responsibility of the brokerages and market makes to not let hedge funds get 140% short. But they did, and I believe on purpose.

Since the public cannot be 140% long, except via options, who was effectively long the other 40% of the shares?

The brokerages and the market makers. To get even more shares for themselves, they restricted trading.

So while these Redditt traders did well, the market makers also gained immensely on the meteoric rise. The more the merrier. They screwed the hedge funds big time and purposely so.

A side artifact of points #1 and #2 is when the shorts are all squeezed out the market makers are the only ones who are short.

When that happens, the bids plunge and the market makers cover lower. 

Author(s): Mish

Publication Date: 30 January 2021

Publication Site: Mish Talk Global Economics Trend Analysis
US Corporate Pension Funded Ratio Climbs to 89.8% in January

Link: https://www.ai-cio.com/news/us-corporate-pension-funded-ratio-climbs-89-8-january/

Excerpt:

The funded ratio of the 100 largest corporate defined benefit (DB) pension plans improved to 89.8% at the end of January from 88.1% at the end of December as their aggregate deficit fell below $200 billion for the first time in more than a year, according to consulting firm Milliman.

With the help of a 16 basis point (bp) increase in the monthly discount rate to 2.62% from 2.46%, the plans’ funding improved by $39 billion in January as their aggregate deficit declined to $196 billion from $235 billion due to liability gains incurred during the month.

Author(s): Michael Katz

Publication Date: 17 February 2021

Publication Site: ai-CIO

Empire Center Rebuttal to NY Health Department Pushback

Excerpt:

“The salient policy question isn’t whether the March 25th memo introduced COVID into nursing homes, but whether it contributed to higher infection and mortality rates.

“The department’s comments show that it either doesn’t understand statistics, or is willfully ignoring our findings. Our analysis does, in fact, show a consistent relationship between transfers from hospitals to nursing homes and COVID fatalities. These findings were robust to several statistical assumptions.

“Our report included a statewide statistical analysis, which showed that transfers were associated with deaths at the 99 percent confidence level. Those statewide estimates are the ones we used to estimate that transfers were associated with hundreds of additional deaths. In digging a bit deeper, we hypothesized a differential effect upstate and downstate, which was then corroborated by our analysis.

Author(s): press release

Publication Date: 19 February 2021

Publication Site: Empire Center for Public Policy

COVID-positive Admissions Were Correlated with Higher Death Rates in New York Nursing Homes

Excerpt:

The admission of coronavirus-positive patients into New York nursing homes under March 25 guidance from the New York State Department of Health was associated with a statistically significant increase in resident deaths.

The data show that each new admission of a COVID-positive patient correlated with .09 additional deaths, with a margin of error (MOE) of plus or minus 0.05.

Further, admitting any number of new COVID-positive patients was associated with an average of 4.2 additional deaths per facility (MOE plus or minus 1.9).

The effect was more pronounced upstate—possibly because the pandemic was less severe in that region at the time, so that even a single exposure would have had a larger impact on the level of risk.

Author(s): Bill Hammond, Ian Kingsbury

Publication Date: 18 February 2021

Publication Site: Empire Center for Public Policy

Pfizer’s COVID-19 vaccine may curb transmission, decrease symptomatic coronavirus cases, Israeli research shows

Link: https://www.abc.net.au/news/health/2021-02-19/covid-19-pfizer-biontech-vaccine-viral-load-drops-first-dose/13156116

Excerpt:

Israeli researchers have found that having just one shot of the Pfizer coronavirus vaccine may lead to lower viral loads, making it harder to transmit COVID-19 if someone becomes infected after the first dose.

And it’s not the only positive research about the Pfizer jab to come out of Israel recently.

A separate independent Israeli study, from the country’s largest healthcare provider Clalit, found a 94 per cent drop in symptomatic COVID-19 infections among 600,000 people who received two doses of the Pfizer vaccine.

Researchers also found the fully inoculated group was 92 per cent less likely to develop severe illness from the virus.

Author(s): Lauren Roberts

Publication Date: 18 February 2021

Publication Site: Australian Broadcasting Commission News

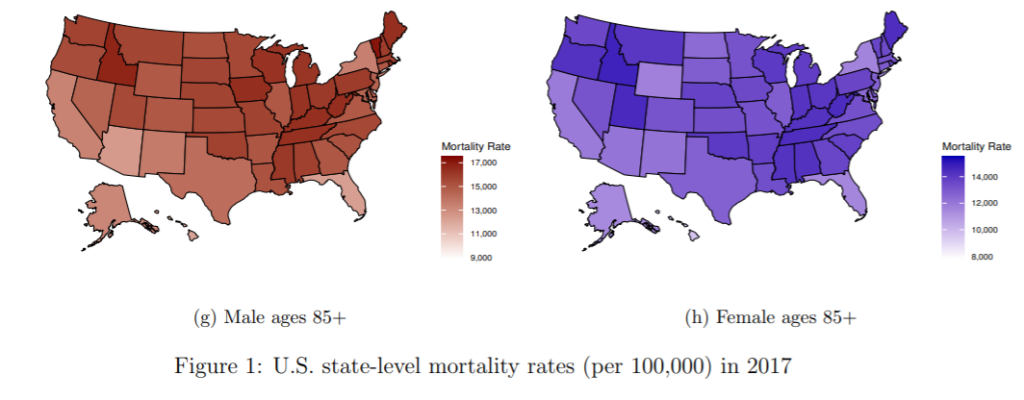
Assessing mortality inequality in the US: What can be said about the future?

Link: https://robjhyndman.com/publications/us-longevity/

Graphic:

Abstract:

This paper investigates mortality inequality across U.S. states by modelling and forecasting mortality rates via a forecast reconciliation approach. Understanding the heterogeneity in state-level mortality experience is of fundamental importance, as it can assist decision-making for policy makers, health authorities, as well as local communities who are seeking to reduce inequalities and disparities in life expectancy. A key challenge of multi-population mortality modeling is high dimensionality, and the resulting complex dependence structures across sub-populations. Moreover, when projecting future mortality rates, it is important to ensure that the state-level forecasts are coherent with the national-level forecasts. We address these issues by first obtaining independent state-level forecasts based on classical stochastic mortality models, and then incorporating the dependence structure in the forecast reconciliation process. Both traditional bottom-up reconciliation and the cutting-edge trace minimization reconciliation methods are considered. Based on the U.S. total mortality data for the period 1969–2017, we project the 10-year-ahead mortality rates at both national-level and state-level up to 2027. We find that the geographical inequality in the longevity levels is likely to continue in the future, and the mortality improvement rates will tend to slow down in the coming decades.

Additional link: https://robjhyndman.com/papers/uslongevity.pdf

Author(s): Han Li, Rob J Hyndman

Publication Date: 14 February 2021

Publication Site: Rob J Hyndman’s personal site

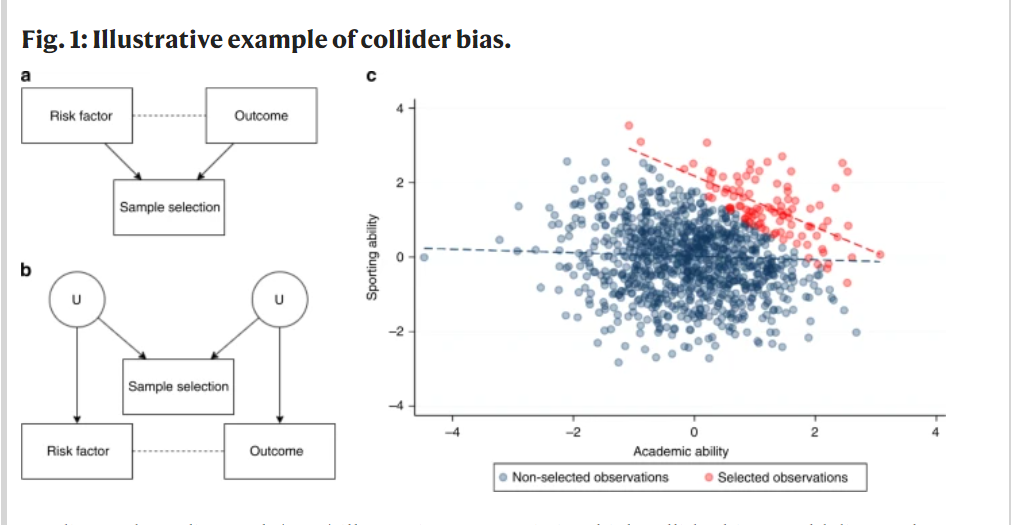
Collider bias undermines our understanding of COVID-19 disease risk and severity

Link: https://www.nature.com/articles/s41467-020-19478-2

Graphic:

Abstract:

Numerous observational studies have attempted to identify risk factors for infection with SARS-CoV-2 and COVID-19 disease outcomes. Studies have used datasets sampled from patients admitted to hospital, people tested for active infection, or people who volunteered to participate. Here, we highlight the challenge of interpreting observational evidence from such non-representative samples. Collider bias can induce associations between two or more variables which affect the likelihood of an individual being sampled, distorting associations between these variables in the sample. Analysing UK Biobank data, compared to the wider cohort the participants tested for COVID-19 were highly selected for a range of genetic, behavioural, cardiovascular, demographic, and anthropometric traits. We discuss the mechanisms inducing these problems, and approaches that could help mitigate them. While collider bias should be explored in existing studies, the optimal way to mitigate the problem is to use appropriate sampling strategies at the study design stage.

Author(s): Gareth J. Griffith, Tim T. Morris, Matthew J. Tudball, Annie Herbert, Giulia Mancano, Lindsey Pike, Gemma C. Sharp, Jonathan Sterne, Tom M. Palmer, George Davey Smith, Kate Tilling, Luisa Zuccolo, Neil M. Davies & Gibran Hemani

Publication Date: 12 November 2020

Publication Site: Nature Communications

Table 2 fallacy and stepwise regression

Link: https://towardsdatascience.com/table-2-fallacy-and-stepwise-regression-smoking-research-on-covid-19-hits-some-familiar-stumbling-615cf2e28c82

Excerpt:

One problem may be the way we teach statistics to data scientists and public health professionals. Multivariable regression is often mistaken for a silver bullet that magically controls away confounding for all variables at once, as long as no confounder is left out. This is what statisticians call the “Table 2 fallacy,” because the adjusted effect sizes in a multivariable model are so often reported in Table 2. Many medical professionals learn to read research articles critically for understanding without ever having been introduced to the Table 2 fallacy.

Confounding is often taught as a purely mathematical concept, but that misses the point. Throwing a large set of variously interrelated variables into a big stepwise regression model might be expected to work, if all you know about confounding is that you should “never leave a confounder out” of your analysis.

Author(s): Savanna Reid

Publication Date: 14 February 2021

Publication Site: towards data science

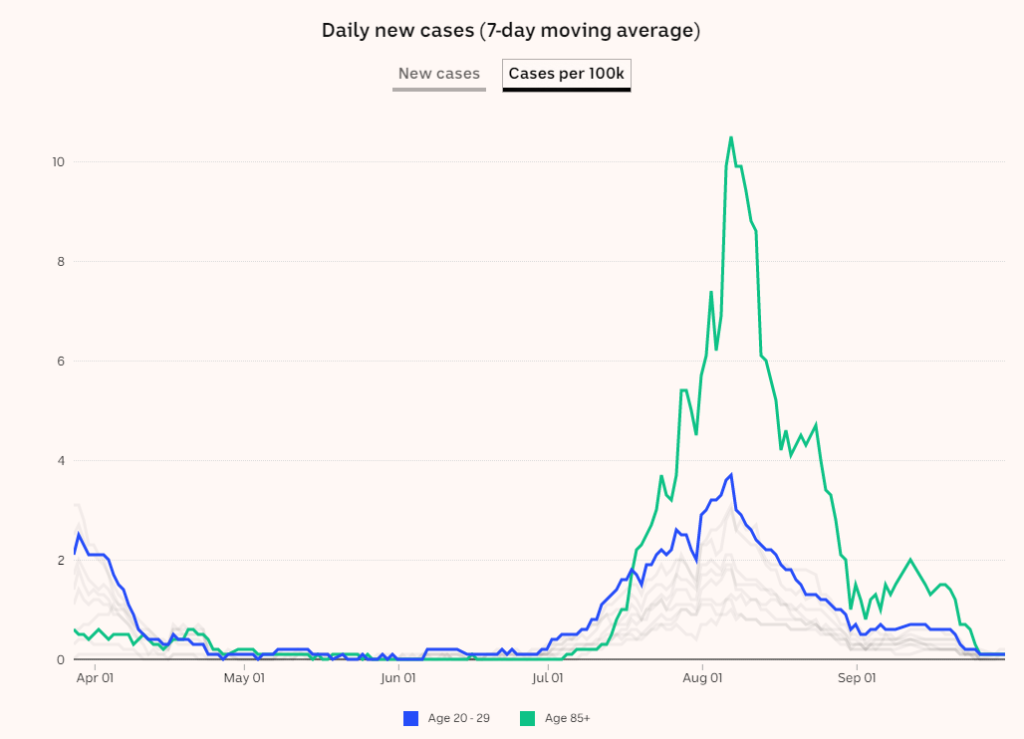
Anatomy of our battle against COVID-19

Link: https://www.abc.net.au/news/2021-01-25/covid-19-spread-through-australia-over-year/13078574?nw=0

Graphic:

Excerpt:

This means Australia’s first-wave case numbers underestimate not only the true number of infections but, more specifically, locally spread infections.

“The first wave was bigger than we will ever know,” Professor Bennett says.

“But lockdown did its job and ultimately stopped that [variant] completely.”

The second wave, however, would prove a far tougher beast.

Author(s): Inga Ting, Nathanael Scott, Alex Palmer and Katia Shatoba

Publication Date: 24 January 2021

Publication Site: Australian Broadcast Commission News

Day-by-day ridership numbers

Link: https://new.mta.info/coronavirus/ridership

Excerpt:

Updated February 18, 2021

We’re keeping this page up to date with systemwide ridership and traffic estimates for subways, buses, Long Island Rail Road, Metro-North Railroad, Access-A-Ride, and Bridges and Tunnels. You can see changes over the past seven days, as well as get a sense of how ridership and traffic differs this year versus last year. We will generally update the page on weekdays, excluding holidays, with the prior day’s figures. At times, data issues may delay the updates.

Download all the data we have published on this page.

Date Accessed: 18 February 2021

Publication Site: MTA

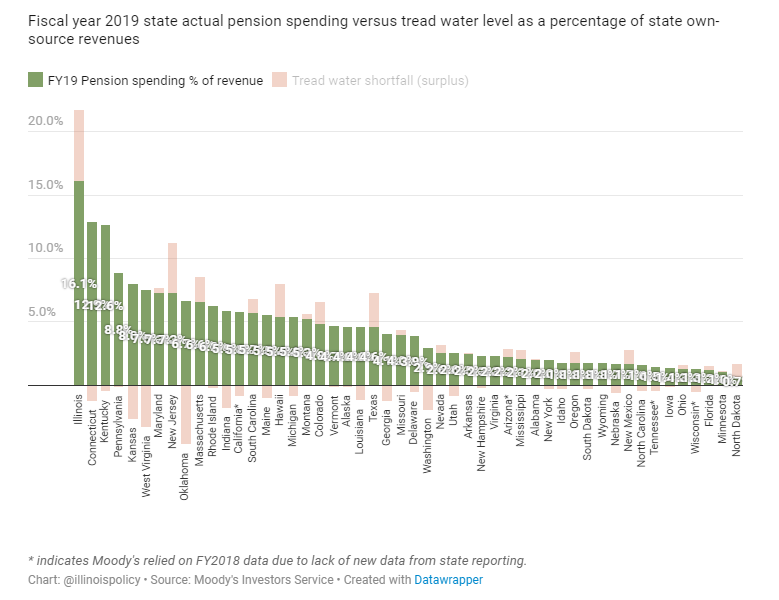
PENSIONS SET TO CONSUME 29% OF ILLINOIS’ BUDGET AMID $7 BILLION DEBT INCREASE

Link: https://www.illinoispolicy.org/pensions-set-to-consume-29-of-illinois-budget-amid-7-billion-debt-increase/

Graphic:

Excerpt:

Pension debt increased $7.1 billion to $144.4 billion in fiscal year 2020, according to the Commission on Government Forecasting and Accountability, or COGFA, the fiscal analysis unit for the General Assembly. The total cost of that debt burden to taxpayers in fiscal year 2022 will be nearly $11.6 billion, including:

$9.4 billion in direct contributions from general revenue sources

$1.1 billion in “other state funds”

$797.9 million in debt service costs on previously issued pension obligation bonds

$264.8 million towards the Chicago Teachers’ Pension Fund, or CTPF

Pensions will consume 28.5% of the budget. That is based on $38.5 billion in expected general revenue for fiscal year 2022, adding in that $1.1 billion from “other state funds” – which would go to critical programs were it not being used for pension debt.

Author(s): Adam Schuster

Publication Date: 17 December 2020

Publication Site: Illinois Policy Institute

Don’t Tax Book Income

Link: https://www.forbes.com/sites/shivaramrajgopal/2021/02/17/dont-tax-book-income/?sh=13874daa2f1f

Excerpt:

There are rumors that the Biden administration is thinking of a 15% minimum tax on companies with book or accounting income (“GAAP” income) of $100 million or more. This proposal tends to bubble up on the national policy agenda off and on with unfailing regularity. For example, in April 2019 Senator Elizabeth Warren raised a similar proposal in the early days of her presidential campaign and the Joint Committee on Taxation, as far back as 2006  examined Treasury’s advocacy of such a tax.  Sadly, this was tried once and was a failure. In 1986, the corporate minimum tax was amended to include an adjustment for book-tax differences, being applied from 1987 to 1989 before it was not renewed.

There are many pitfalls associated with the idea of taxing book income. For starters, companies that meet the threshold will try and minimize GAAP income to pay lower taxes. One could argue that is desirable as we often suspect that companies today inflate GAAP income to look better to their shareholders. Tying tax rates to book income would imply that earnings management, or attempts to artificially inflate GAAP earnings, will now incur a real cash outflow cost in terms of higher taxes. However, the usefulness of GAAP earnings would be severely compromised and if distorted by tax related maneuvers, will give managers and speculators even more fuel to spin narratives to justify wild valuations. One can even imagine a world where stock return volatility driven by uninformative earnings numbers might drive away uninformed investors from equity markets.

Author(s): Shivaram Rajgopal

Publication Date: 17 February 2021

Publication Site: Forbes