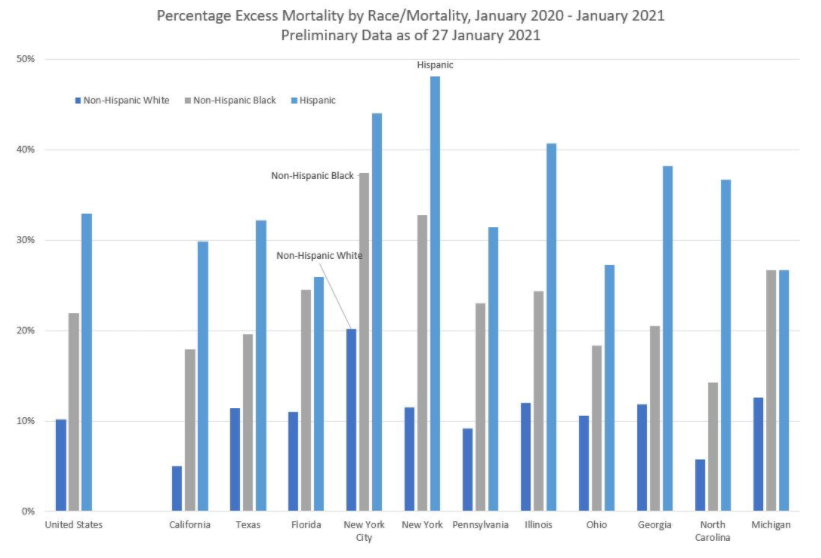
Overall, excess mortality (in a relative sense) for Hispanics is about three times than that seen by non-Hispanic Whites, and non-Hispanic Blacks have excess mortality about twice that of non-Hispanic Whites.
Note that New York City by itself has a very large amount of excess mortality. You can see why New York, as an area, reacted very drastically last year. When I saw the mortality spike coming from the city last year, I was just fine staying at home… because I could. The trade-offs have been relatively easy for me to see.
Nearly two dozen fiduciaries of public retirement plans and others expressed concern over BlackRock’s internal practices and stewardship stances on companies’ political spending and lobbying activity.
Day traders fueling enormous gains in popular stocks such as GameStop Corp. are also powering big swings for another suddenly hot investment: so-called blank-check companies.
Special-purpose acquisition companies—shell companies planning to merge with private firms to take them public—are rising more than 6% on average on their first day of trading in 2021, up from last year’s figure of 1.6%, according to University of Florida finance professor Jay Ritter. Before 2020, trading in SPACs was muted when they made their debut on public markets.
Now, shares of blank-check companies almost always go up. The last 140 SPACs to go public have either logged gains or ended flat on their opening day of trading, per a Dow Jones Market Data analysis of trading in blank-check companies through Thursday. One hundred and seventeen in a row have risen in their first week. The gains tend to continue, on average generating bigger returns going out to a few months.
Difficult trade-offs therefore need to be made, and this is where things can be deadly controversial—pun intended—when lives and livelihoods are involved, especially on a massive scale. As Leonelli asks, “What are the priorities underpinning alternative construals of ‘life with covid’? … Whose advice should be followed, whose interests should be most closely protected, which losses are acceptable and which are not?” Such questions clearly cannot (and should not) be answered by data science or data scientists alone, but the data science community has both the ability and responsibility to establish scientific and persuasive evidence to help to reach sustainable compromises that are critical for maintaining a healthy human ecosystem.
Public servants often spend multiples of what their salaries will be in the jobs they seek in order to get those jobs since they have other incentives. One of those is likely the pension, even for part time employment, that comes with the job.
Though job-hopping makes it impossible to finger all the mayors or council people who game the system, here are some whose last employer was the Office of the Governor, Senate, or General Assembly who, based on data on retirees in the New Jersey Retirement System taken from the the state pension website are getting over $50,000 annually – along with some other familiar names.
$GME was first pitched as an investment on r/WallStreetBets about 2 years ago, but the current craze built up over the past 12 months.
Members on the subreddit r/WallStreetBets believed that GameStop, with 5k+ brick ‘n’ mortar locations, could turn around its fortunes by going digital.
On Aug. 31, 2020, Ryan Cohen — the billionaire founder of pet company Chewy — bought up a big position in $GME (he now owns 10%+ of it) with plans to modernize the company.
In the months since, a number of prominent hedge funds (Citron, Melvin Capital) revealed they were betting against (AKA short selling) $GME.
Typically in short selling, you: 1) borrow a stock; 2) sell it to a buyer; and 3) if the price of the stock falls, you can buy it for a cheaper price you sold it at and return the stock to the person who lent it to you.
One risk of short selling is called a “short squeeze.” Since you have to eventually return the stock you borrowed, problems can arise if there is a limited supply of the stock.
In a “short squeeze,” the underlying stock will get bid up as short sellers try to get their hands on stock that they have to return.
Options trading — the right, but not obligation, to buy a stock at a certain price — is also driving $GME up as institutions that sell these options are buying $GME stock to hedge their position.
$GME stock is on an upward tear as these market mechanics play out and r/WallStreetBets traders coordinate their efforts.
The chaos of the vaccine rollout in the US has been well documented: states receiving half their expected doses; clinics canceling first shots because of unreliable supplies; people endlessly hitting “Refresh” on sign-up websites or lining up outside clinics without an appointment, hoping for a spare shot.
The CDC saw this coming.
“VAMS was intended to fill a need that states and jurisdictions were not equipped to do themselves,” says Noam Arzt, the president of HLN Consulting, which helps build health information systems.
Increase the public pensions funding target to 100% from 90% in accordance with actuarial best practices. The goal year for 100% funding would remain 2045.
Gradually increase retirement ages for current workers under age 45 by a maximum of five years.
Apply a pensionable salary cap of $100,000 that grows with inflation. Government workers could still earn more than $100,000, but their pensions could not be based on more than the cap. The cap would only apply to employees not currently receiving a retirement check.
Replace Tier 1 retirees’ 3% compounding benefit increase with true cost-of-living adjustments tied to inflation. Annual increases would be simple, not compounding, and rise with the consumer price index for urban consumers, as reported by the U.S. Bureau of Labor Statistics.
Increase Tier 2 COLAs from half of inflation to full inflation. This would end the unfair subsidization of older workers by younger workers and could prevent a potential lawsuit.
Implement COLA holidays to allow inflation to catch up to past benefit increases. If a worker has been retired for eight years or more, they would skip every other year for 16 years for a total of eight adjustment periods at 0%. If a retiree has been receiving benefits for seven years, they would skip one payment every other year for 14 years, and so on.
Enroll all newly hired employees in a defined contribution personal retirement account with a 4% guaranteed employer match. This would ensure the state never gets into pension trouble again. This would also provide state workers with a portable retirement benefit they could take with them from employer to employer, rather than being forced to stay with the state in order to maximize retirement benefits.
One antidote to this is true experimentation in which treatment is randomly assigned within the homogenous target population. Experimentation, particularly A/B tests, have become a mainstay of industry data science, so why observational causal inference matters?
Some situations you cannot test due to ethics or reputational risk
Even when you can experiment, understanding observational causal inference can help you better identify biases and design your experiments
Testing can be expensive. There are direct costs (e.g. testing a marketing promotion) of instituting a policy that might not be effective, implementation costs (e.g. having a tech team implement a new display), and opportunity costs (e.g. holding out a control group and not applying what you hope to be a profitable strategy as broadly as possible)2
Randomized experimentation is harder than it sounds! Sometimes experiments may not go as planned, but treating the results as observational data may help salvage some information value
Data collection can take time. We may want to read long-term endpoints like customer retention or attrition after many year. When we long to read an experiment that wasn’t launched three years ago, historical observational data can help us get a preliminary answer sooner
It’s not either-or but both-and. Due to the financial and temporal costs of experimentation, causal inference can also be a tool to help us better prioritize what experiments are worth running
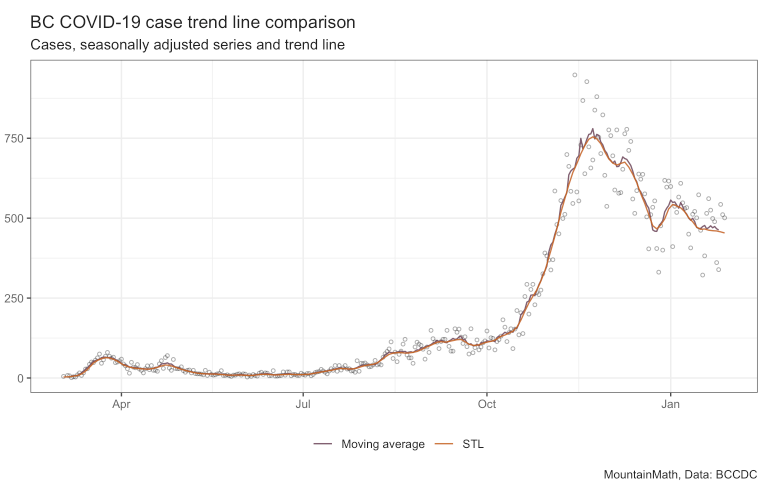
Data is inherently noisy, trend lines are a way to filter out noise and focus on the main movements of a time series. “Are we trending up or down?” is a simple yet important question, but it can be hard to answer by just looking at the raw data. In that sense a trend line is simply a way to de-noise the data.
But how do we distinguish noise from the “real” signal in the data? First we need to understand the “data generating process”. In case of COVID-19 timelines that’s viral growth, so we expect the main signal of our time series to be exponential growth with periods of constant growth rates, with noise added on top of that. (This can also be tested directly by running tests on the COVID-19 cases time series.)
Melvin Capital, the hedge fund that was wrongfooted by retail traders who drove up shares in GameStop and other companies it had bet against, lost 53 percent in January, according to people familiar with the firm’s results.
The New York-based hedge fund sustained a $4.5 billion fall in its assets from the end of last year to $8 billion, even after a $2.75 billion cash injection from Steve Cohen’s Point72 Asset Management and Ken Griffin’s Citadel.
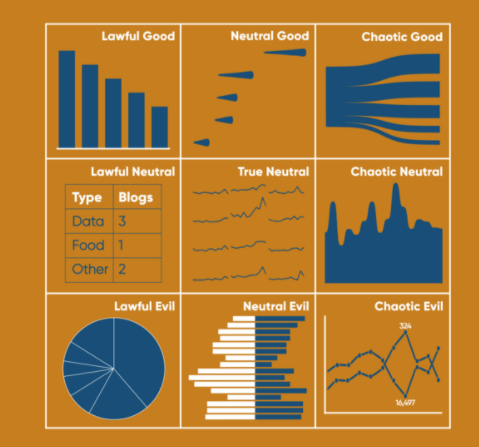
For this specific application, when I think of lawfulness, I am going to mainly assess the likelihood to be misused. And for good versus evil, I’ll be looking at how well they can typically help the user understand the data.
Lawful Good: Bar Chart
This is the best alignment you can be. In traditional use, lawful good applies to people that both follow the rules and help others. Here I’m applying it to a chart that I think is often used well and is easy to read. Name a better liked and more used chart than the bar chart – you can’t. 10/10 analysts would recommend.