Despite vehicle safety improvements, US pedestrian deaths soar

Link: https://scrippsnews.com/stories/despite-vehicle-safety-improvements-us-pedestrian-deaths-soar/

Graphic:

Excerpt:

Samuel’s death is part of a growing trend in America, where pedestrian and cyclist fatalities are up 60% since 2011 to more than 8,000 last year.

In the past 25 years, the percentage of people who died in road crashes — while inside a vehicle — dropped from 80% of all road deaths to 66%. At the same time, the share of pedestrian and bicyclist deaths climbed sharply – making up 20% of all road deaths in 1997, to now accounting for 34% of all road deaths.

Nicole Brunet is with the nonprofits Bicycle Coalition of Greater Philadelphia and Families for Safe Streets. She says street design is part of the issue.

“If you’re somebody in a car, the street is designed perfect for you,” Brunet said. “The ideal street is balanced: A street that’s built for a pedestrian and a bicyclist, somebody that has mobility issues. We need to think about the most vulnerable user of the road.”

Author(s): Maya Rodriguez

Publication Date: 5 Oct 2023

Publication Site: Scripps

The Debt Crisis Is Getting Real

Link: https://reason.com/2023/10/04/the-debt-crisis-is-getting-real/

Excerpt:

When Yglesias wrote that column for Vox in 2016, the federal government owed about $19 trillion. Today, it owes more than $33 trillion, and we just added another $2 trillion in a fiscal year with no major national emergencies.

In short, the federal government followed Yglesias’ advice. But it might be more accurate to say it went along with what was clearly a bipartisan consensus formed in the mid-2010s: that borrowing was cheap, debt was easy to afford, and deficit spending allowed everyone to enjoy “a better life” with none of the downsides of austerity.

Unfortunately, the downsides have arrived.

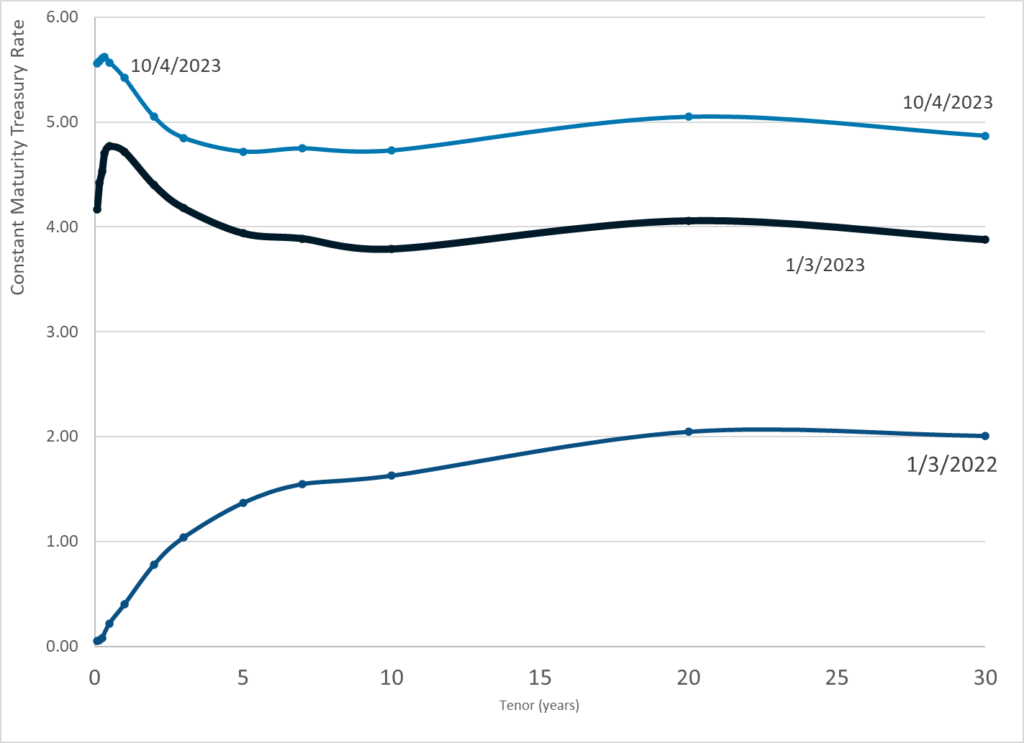
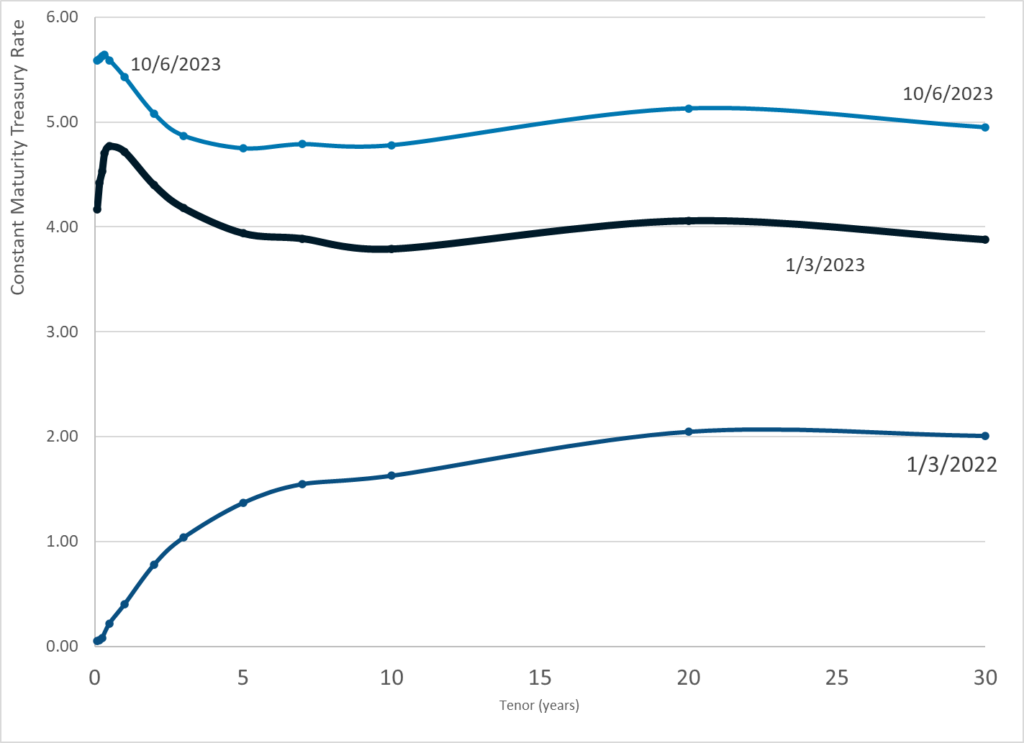
The yields on U.S. Treasury bonds are now hitting levels not seen in decades. The 10-year Treasury bond is nearing 5 percent, while the 20-year bond has already crossed that threshold—and some analysts expect higher yields to be coming, CNBC reported Tuesday.

Why does that matter? “We took out a mortgage thinking we’d be paying 2%, but now we’re paying 5%,” Marc Goldwein, director of policy at the Committee for a Responsible Federal Budget (CRFB) wrote on X (formerly known as Twitter) on Tuesday.

Unlike most mortgages, which have fixed interest rates, much of the U.S. government’s debt is tied up in short-term bonds which periodically “roll over” into new bonds with updated interest rates. As a result, higher interest rates mean higher interest payments—and those funds come directly out of the federal budget, leaving less revenue for everything else the government might aspire to do, whether funding welfare programs or buying more fighter jets.

“That debt, borrowed at low rates, is now being rolled over into Treasuries paying interest rates between 4.5 and 5.6 percent,” the CRFB explained last month. “Though borrowing seemed cheap during those periods, policymakers failed to account for rollover risk, and we are now facing the cost.”

Interest payments on the debt will be the fastest-growing part of the federal budget over the next three decades, according to the Congressional Budget Office’s (CBO) projections. In the shorter term, interest payments are set to triple by 2033, when they will cost an estimated $1.4 trillion—a total that will only grow higher if more unplanned borrowing takes place before then, or if interest rates rise higher than the CBO expects.

Author(s): Eric Boehm

Publication Date: 4 Oct 2023

Publication Site: Reason

Map of Data Visualization Books

Link: https://jschwabish.substack.com/p/map-of-data-visualization-books

Graphic:

Excerpt:

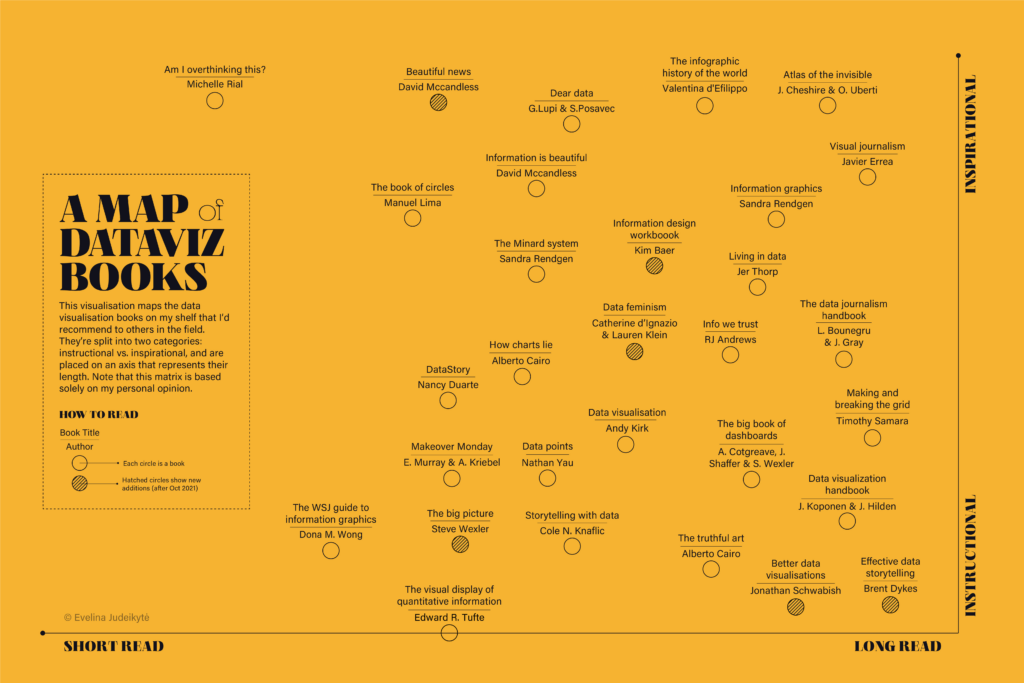
Information designer Evelina Judeikyte published this Map of DataViz Books back in 2021 and updated it in December 2022. It consists of 30 books she has read across two axes: Length of read (short vs. long) and instructional vs. inspirational (arguable whether that’s continuous or not). Books Evelina read in 2022 were shown with the hatched pattern and I was pleased to see my Better Data Visualizations book appear on the list (in the bottom-right corner). We’ll see if she publishes a new one at the end of 2023.

I’m not sure if I saw the original image in 2021, but the 2022 version has been in the back of my head for months.

Obviously, the two dimensions are Evelina’s opinions about the books and I don’t intend to criticize or argue with her representation of the space. I do believe books can be both instructional and inspirational, but that’s not why it’s been stuck in my head.

Instead, I’ve been thinking about how I might represent the new wave of data visualization books that go beyond—or maybe in just a different direction—than the instructional/inspirational continuum.

Author(s): Jon Schwabish

Publication Date: 4 Oct 2023

Publication Site: PolicyViz Newsletter on substack

SBF Was Reckless From the Start

Link: https://www.bloomberg.com/opinion/articles/2023-10-04/sbf-was-reckless-from-the-start?srnd=undefined#xj4y7vzkg

Excerpt:

First: “A Jane Street intern had what amounted to a professional obligation to take any bet with a positive expected value”? Really? I feel like, if you are a trading intern, you are really there to learn two things. One is, sure, take bets with positive expected value and avoid bets with negative expected value.

But the other is about bet sizing. As a Jane Street intern, you have $100 to bet each day, and your quasi-job is to turn that into as much money as possible. Is betting all of it (or even $98) on a single bet with a 1% edge really optimal?[6] 

People have thought about this question! Like, this is very much a central thing that traders and trading firms worry about. The standard starting point is the Kelly criterion, which computes a maximum bet size based on your edge and the size of your bankroll. Given the intern’s bankroll of $100, I think Kelly would tell you to put at most $10 on this bet, depending on what exactly you mean by “this bet.”[7] Betting $98 is too much.

I am being imprecise, and for various reasons you might not expect the interns to stick to Kelly in this situation. But when I read about interns lining up to lose their entire bankroll on bets with 1% edge, I think, “huh, that’s aggressive, what are they teaching those interns?” (I suppose the $100 daily loss limit is the real lesson about position sizing: The interns who wipe out today get to come back and play again tomorrow.) 

But I also think about a Twitter argument that Bankman-Fried had with Matt Hollerbach in 2020, in which Bankman-Fried scoffed at the Kelly criterion and said that “I, personally, would do more” than the Kelly amount. “Why? Because ultimately my utility function isn’t really logarithmic. It’s closer to linear.” As he tells Lewis, “he had use for ‘infinity dollars’” — he was going to become a trillionaire and use the money to cure disease and align AI and defeat Trump, sure — so he always wanted to maximize returns.

But as Hollerbach pointed out, this misunderstands why trading firms use the Kelly criterion.[8] Jane Street does not go around taking any bet with a positive expected value. The point of Kelly is not about utility curves; it’s not “having $200 is less than twice as pleasant as having $100, so you should be less willing to take big risks for big rewards.” The point of Kelly is about maximizing your chances of surviving and obtaining long-run returns: It’s “if you bet 50% of your bankroll on 1%-edge bets, you’ll be more likely to win each bet than lose it, but if you keep doing that you will probably lose all your money eventually.” Kelly is about sizing your bets so you can keep playing the game and make the most money possible in the long run. Betting more can make you more money in the short run, but if you keep doing it you will end in ruin.

Author(s): Matt Levine

Publication Date: 4 Oct 2023

Publication Site: Bloomberg
Overdoses soared even as prescription pain pills plunged/Highest death rates hit counties where doses of pain pills per person had been top in nation

Link: https://www.washingtonpost.com/investigations/2023/09/12/us-overdose-deaths-opioid-crisis/

Excerpt:

The number of prescription opioid pain pills shipped in the United States plummeted nearly 45 percent between 2011 and 2019, new federal data shows, even as fatal overdoses rose to record levels as users increasingly used heroin, and then illegal fentanyl.

The data confirms what’s long been known about the arc of the nation’s addiction crisis: Users first got hooked by pain pills saturating the nation, then turned to cheaper and more readily available street drugs after law enforcement crackdowns, public outcry and changes in how the medical community views prescribing opioids to treat pain.

The drug industry transaction data, collected by the Drug Enforcement Administration and released Tuesday by attorneys involved in the massive litigation against opioid industry players, reveals that the number of prescription hydrocodone and oxycodone pills peaked in 2011 at 12.8 billion pills, and dropped to fewer than 7.1 billion by 2019. Shipments of potent 80-milligram oxycodone pills dropped 92 percent in 2019 from their peak a decade earlier.

Many of the counties with the highest fentanyl death rates — in hard-hit states such as West Virginia, Kentucky and Ohio — started out with alarmingly high doses of prescription pills per capita, according to a Washington Post analysis of the DEA data and federal death records.

Counties with the highest average doses of legal pain pills per person from 2006 to 2013 suffered the highest death rates in the nation over the subsequent six years.

….

Annual overall overdose deaths reached a grim milestone in 2021, surpassing 100,000 for the first time in U.S. history. More than 110,000 people died of drug overdoses in 2022, two-thirds of whom succumbed to synthetic opioids such as fentanyl, according to estimates by the Centers for Disease Control and Prevention.

Author(s): Rich, Steven; Ovalle, David

Publication Date: 12 Sep 2023

Publication Site: Washington Post