Graphic:
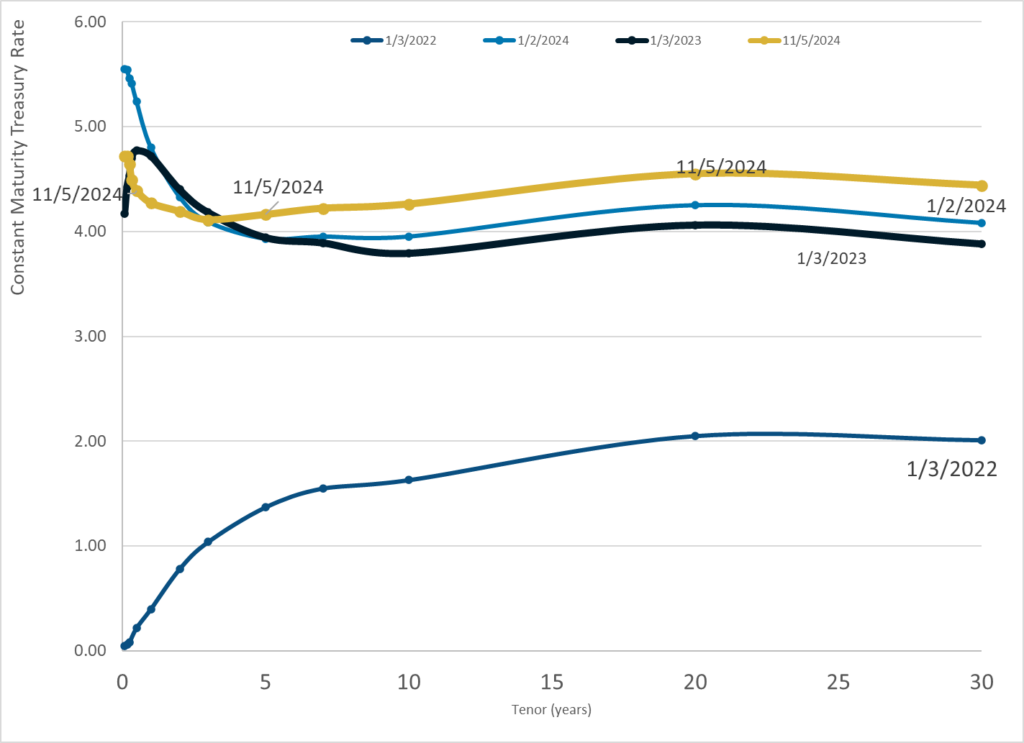
Publication Date: 5 Nov 2024
Publication Site: Treasury Dept
All about risk
Graphic:
Publication Date: 5 Nov 2024
Publication Site: Treasury Dept
Graphic:

Publication Date: 23 Oct 2024
Publication Site: Treasury Department
Graphic:
Excerpt:
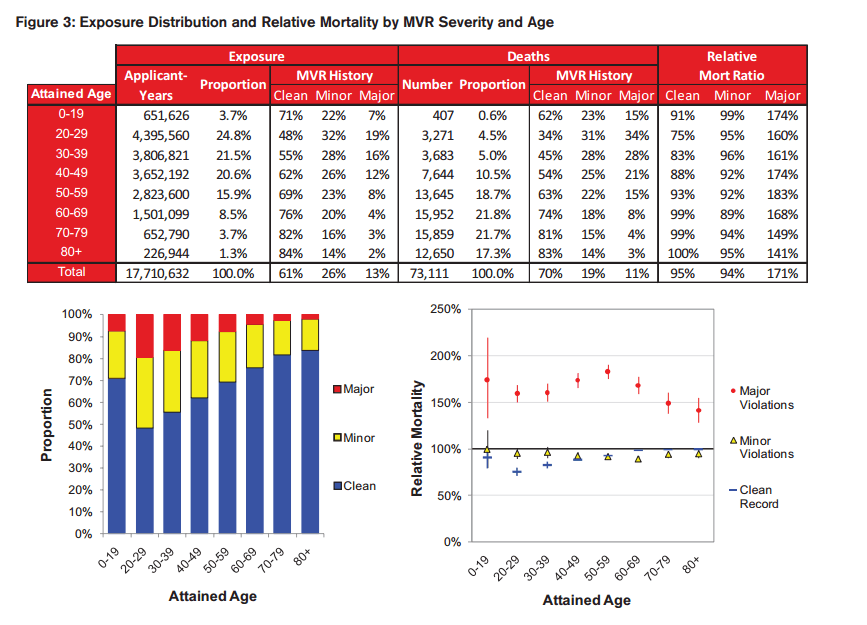
This paper analyzes the all-cause mortality experience of a large cohort of applicants linked to the number and severity of their recent driving infractions. The study verifies that significant excess mortality risk exists for applicants with a recent history of either major or frequent driving violations. The extra mortality risk for drivers with adverse MVRs is persistent across ages for both genders. The results from this study also suggest that MVRs likely have positive protective value across a wide spectrum of ages and face amounts.
Author(s): Timothy L. Rozar
Publication Date: April 2012
Publication Site: RGA Re
Graphic:

Excerpt:
To determine where residents are most concerned about life insurance, Beca Life ranked them by monthly online searches for terms related to the product, based on data from Google Keyword Planner. The total number of monthly average searches in each state was compared against its population, to determine the average monthly searches per 100,000 people.
The top five states have an average of 852.84 people per 100,000 seeking life insurance via search engine each month.
Publication Date: 23 Oct 2024
Publication Site: Digital Insurance
Graphic:
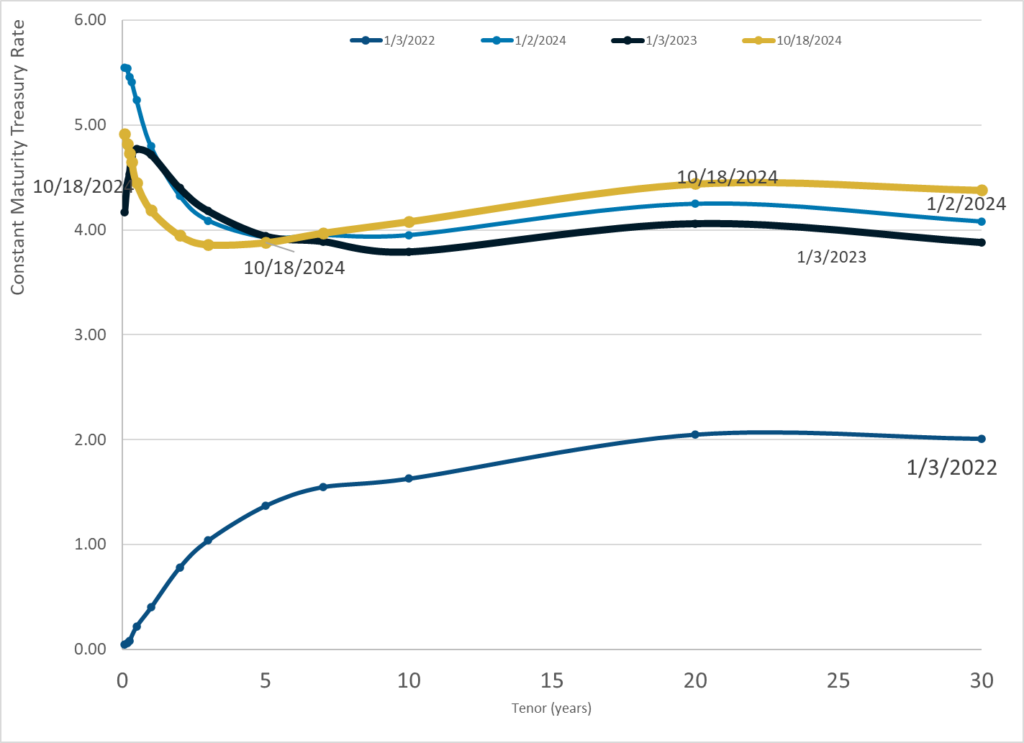
Publication Date: 18 Oct 2024
Publication Site: Treasury Dept
Graphic:

Publication Date: 17 Oct 2024
Publication Site: Treasury Dept
Graphic:
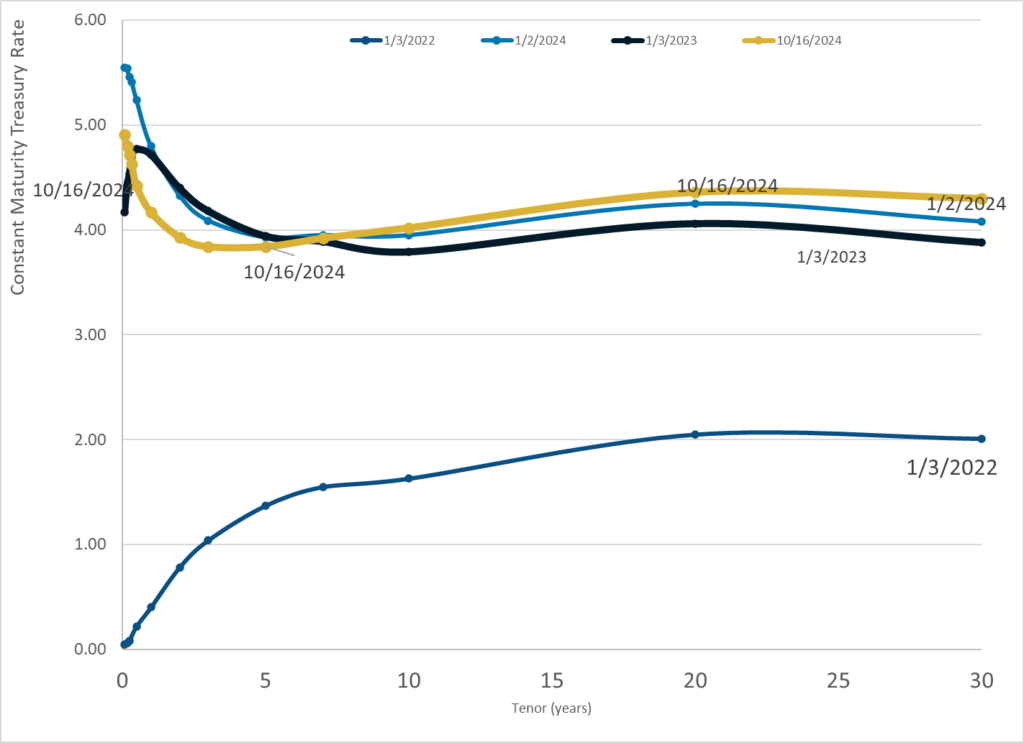
Publication Date: 16 Oct 2024
Publication Site: Treasury Dept
Graphic:
Publication Date: 15 Oct 2024
Publication Site: Treasury Dept
Graphic:

Publication Date: 11 Oct 2024
Publication Site: Treasury Dept
Link: https://www.bloomberg.com/opinion/articles/2024-10-14/td-was-convenient-for-criminals?srnd=undefined
Excerpt:
But TD Bank’s problem — which led to the largest AML-failures penalty ever — was not just about ignoring red flags. The more fundamental problem is that TD Bank tried to do its anti-money-laundering compliance on the cheap, and the prosecutors and regulators hate that. The Justice Department says:
[The TD Bank Global Anti-Money Laundering (GAML) group]’s budget was a primary driver of its decisions about projects, hiring, staffing, and technology enhancements throughout the relevant period. GAML executives strove to maintain what TD Bank Group referred to as a “flat cost paradigm” or “zero expense growth paradigm,” meaning that each department’s budget, including GAML’s, was expected to remain flat year-over-year, despite consistent growth in TD Bank Group’s revenue over the relevant period. This budgetary pressure originated with senior bank executives and was achieved within GAML and US-AML by [its chief AML officer] and [its Bank Secrecy Act officer], both of whom touted their abilities to operate within the “flat cost paradigm without compromising risk appetite” in their self-assessments. GAML’s base and project expenditures on USAML were less in fiscal year 2021 than they were in fiscal year 2018 and were not sufficient to address AML deficiencies including substantial backlogs of alerts across multiple workstreams, despite TDBNA’s profits increasing approximately 26% during the same period. In 2019, [the chief AML officer] referred to the Bank’s “historical underspend” on compliance in an email to the Group senior executive responsible for the enterprise AML budget, yet the US-AML budget essentially stayed flat. GAML and US-AML employees explained to the Offices that budgetary restrictions led to systemic deficiencies in the Bank’s transaction monitoring program and exposed the Bank to potential legal and regulatory consequences.
That, I think, is why the fine was so big. The message that this case is meant to send to banks is “if your compliance team wants more money to build a better AML program, you’d better give it to them, because otherwise we will fine you orders of magnitude more money than you would have spent.” The attorney general said:
TD Bank chose profits over compliance, in order to keep its costs down.
That decision is now costing the bank billions of dollars in criminal and civil penalties.
The deputy attorney general added:
We are putting down a clear marker on what we expect from financial institutions — and the consequences for failure.
When it comes to compliance, there are really only two options: invest now – or face severe consequences later.
As I’ve said before, a corporate strategy that pursues profits at the expense of compliance isn’t a path to riches; it’s a path to federal prosecution.
One job of a bank is to stop crime, which means that banks employ thousands of people who essentially work for the US Department of Justice. But the Department of Justice has no direct control over how many of those people there are, how much they get paid or what resources they have. Law enforcement agencies cannot directly set the banks’ budgets for anti-money-laundering programs, even though those budgets really are part of law enforcement. It is, perhaps, a frustrating situation: The Justice Department would like banks to spend more money catching criminals, and it can’t quite make them.
Except obviously it can. The Justice Department can’t directly set banks’ AML budgets, but it can do it indirectly, and it just did. If you are a bank compliance officer and you want to hire 2,000 people and get some shiny new computers, you can go to your regulators and say “do we need to spend this money on AML,” and they will say “that would be better,” and you will go to your chief executive officer with a transcript of the TD Bank press conference, and you will get whatever you want.
Author(s): Matt Levine
Publication Date: 14 Oct 2024
Publication Site: Bloomberg
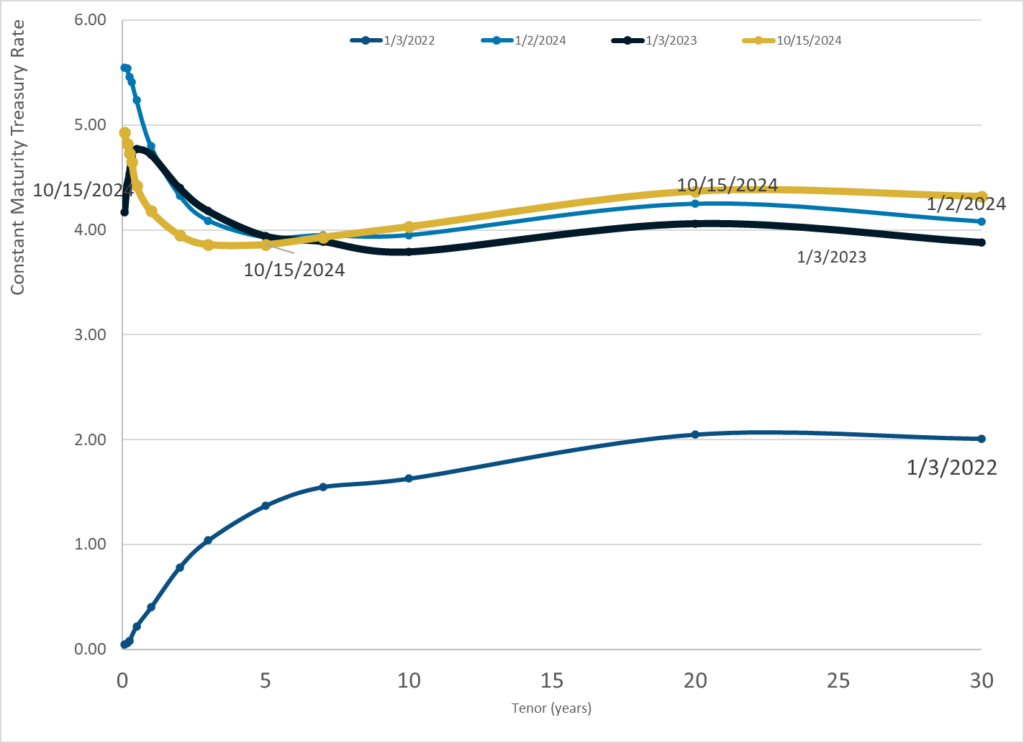
Graphic:
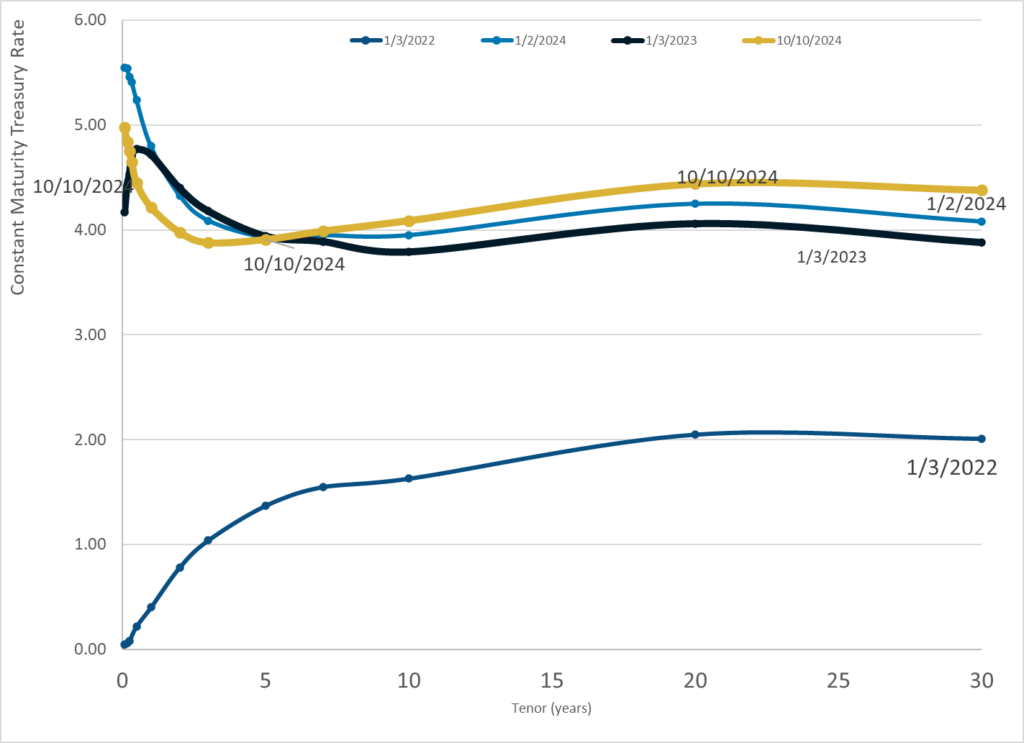
Publication Date: 10 Oct 2024
Publication Site: Treasury Dept
Excerpt:
The Ohio State Teachers’ Retirement System cannot invest its way to a permanent COLA, Brian Grinnell, former chief actuary of the $97.3 billion pension fund, told Pensions & Investments.
Grinnell left the pension fund in May after more than 10 years as its chief actuary. In a Sept. 27 interview, he said his responsibilities were primarily to help STRS staff and the board understand the risks the pension fund has faced and help develop a forward-looking plan to make decisions with long-term outcomes in mind.
In his interview, he said, “I was not comfortable with the direction the plan was headed, and I didn’t feel like my continued participation would be positive.”
….
The pension reform law, SB342, was one of five laws that addressed funding issues at all five of Ohio’s state retirement systems and was drafted as a result of severe stock market declines that came from the Great Recession in 2008 and 2009. Among all the state systems, STRS was the worst off in 2012 with a funding ratio of 57.6% as of June 30 of that year. Additionally, the amortization period for the retirement system’s unfunded pension liabilities under the STRS defined benefit plan had become infinite — meaning that it would never become fully funded.
Grinnell said STRS has had to contend with the challenge of being an extremely mature pension fund: Essentially, there is more money being sent out to retirees receiving benefits now relative to the future contributions the pension fund can expect from current and future teachers.
“Here’s where STRS is a little bit of an unusual situation because it is a fixed-rate plan,” Grinnell said, “so both the benefits and the contributions are essentially fixed by statute. So most plans, if they have a bad year in terms of investment performance, the contribution rate goes up the following year to fill that hole. That doesn’t happen at STRS.”
Grinnell said when a pension fund is both a mature plan and has that fixed-rate contribution and fixed benefits, it’s very difficult to recover from any kinds of market downturns. He noted that all five of Ohio’s state retirement systems have that fixed-rate structure.
“Most other public pensions do not have that kind of structure,” he said, “and I think that tends to work all right for an immature plan, a plan that’s growing and not paying out a lot of benefits relative to the contributions.”
Author(s): Rob Kozlowski
Publication Date: 2 October 2024
Publication Site: Pensions & Investments