Link:https://www.census.gov/library/stories/2022/01/gender-pay-gap-widens-as-women-age.html
Graphic:
Excerpt:
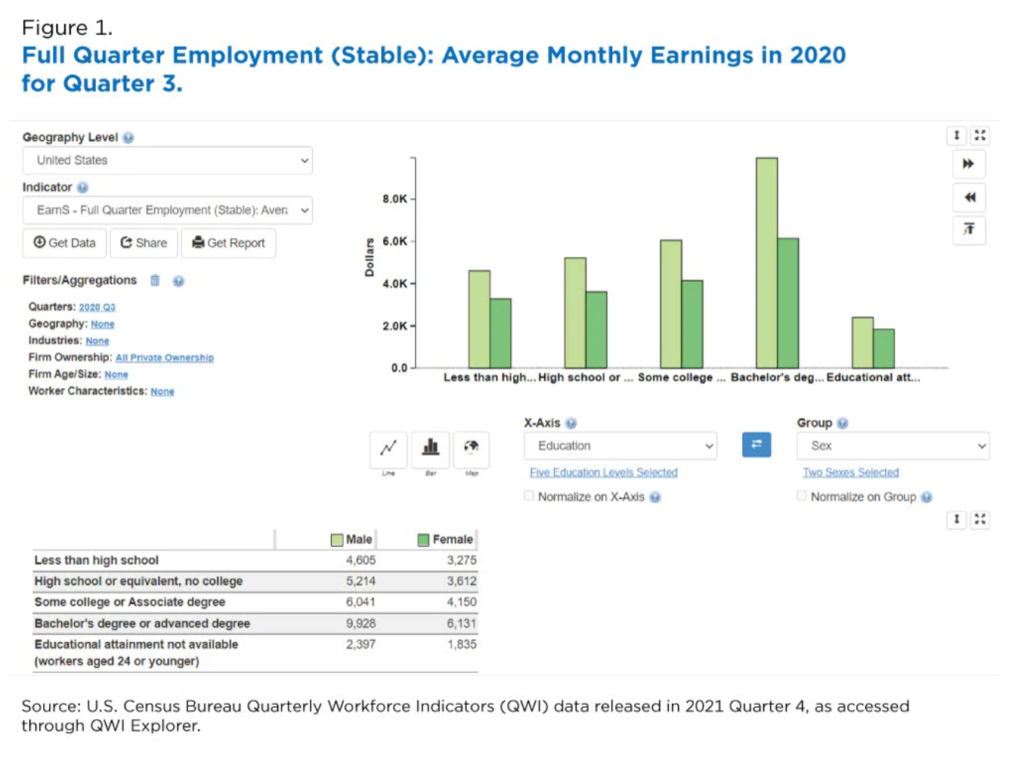
Women are over-represented in lower paying jobs and, as they age, the pay gap widens even more.
The U.S. Census Bureau’s Quarterly Workforce Indicators (QWI) shows the pay and age dynamic of women and men. Here, we looked at workers ages 35-44.
According to the QWI data based on unemployment insurance wage records for the third quarter of 2020 (the most recent national data), women in the United States earned 30% less than men and that pay gap increased with age.
….
QWI Explorer provides easy access to national data on earnings of women and men. Figure 1 shows a gap in monthly wages of almost $4,000 for women compared to men with a bachelor’s or advanced degree.
Author(s):EARLENE K.P. DOWELL
Publication Date: 27 Jan 2022
Publication Site: U.S. Census Bureau