Motor Vehicle Accident Deaths, Part 2: Age-Related Trends with Provisional Results in 2021

Link: https://marypatcampbell.substack.com/p/motor-vehicle-accident-deaths-part?s=w

Graphic:

Excerpt:

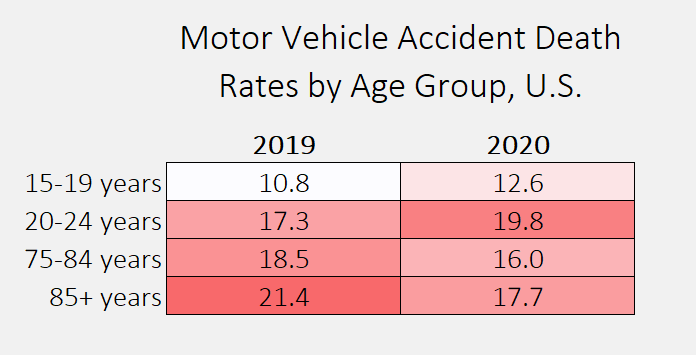
The rates are per 100,000 people for the year, but the point is who has the highest, and we see that the answer is:

For 2019: age 85+

For 2020: age 20-24

I threw in the age 15-19 group as ringers, by the way. When we get to all the age groups, they’re not even #4 in the ranking.

Just in that little table, you can see that the rates went up for the youngsters and dropped for the seniors. Think about why that might be.

As noted in my polling question, I’m not adjusting for the number of miles driven, and I’m not going to dig for that data now. But would you like to make some assumptions about the driving habits of these different groups? Especially during the pandemic?

Author(s): Mary Pat Campbell

Publication Date: 2 March 2022

Publication Site: STUMP at substack

Allstate, John Hancock partner on safe driving for Vitality points

Link: https://www.dig-in.com/news/allstate-and-john-hancock-partner-safe-driving-telematics

Excerpt:

John Hancock and Allstate have announced a partnership to reward John Hancock Vitality members with points for safe driving. The partnership is the first of its kind, and comes in response to an increase in vehicle crash-related injuries. Customers will benefit from understanding how their choices, including driving behavior, impact their overall health, John Hancock believes.

….

The Vitality Program, which combines life insurance with education, incentives and rewards to help members lead healthier, longer lives, will allow members to submit proof of safe driving status in Allstate’s usage-based insurance program through a cashback reward email or by submitting a recent bill to show a safe-driving discount.

Motor vehicle deaths in the U.S. rose 18.4% in the first six months of 2021 over 2020, according to data from the U.S. Department of Transportation’s National Highway Traffic Safety Administration. An estimated 20,160 people died in motor vehicle crashes in the first half of 2021, the largest number of projected fatalities since the same period in 2006. Research into driving behavior from March 2020 through June 2021, shows that speeding and traveling without a seatbelt remain higher than pre-pandemic times, according to findings from NHTSA.

Author(s): Kaitlyn Mattson

Publication Date: 24 January 2022

Publication Site: Digital Insurance

Rise in Non-Covid-19 Deaths Hits Life Insurers

Link: https://www.wsj.com/articles/rise-in-non-covid-19-deaths-hits-life-insurers-11645576252

Graphic:

Excerpt:

In earnings calls for the past two quarters, Globe Life Inc.,Hartford Financial Services Group Inc., Primerica Inc. andReinsurance Group of America Inc. were among insurers noting higher non-Covid-19 deaths, compared with pre-pandemic baselines.

“The losses we are seeing continue to be elevated over 2019 levels due at least in part, we believe, to the pandemic and the existence of either delayed or unavailable healthcare,” Globe Life finance chief Frank Svoboda told analysts and investors earlier this month.

Among the non-coronavirus-specific claims are deaths from heart and circulatory issues and neurological disorders, he said. “We anticipate that they’ll start to be less impactful over the course of 2022 but we do anticipate that we’ll still at least see some elevated levels throughout the year,” he said.

Primerica executives similarly cautioned in their fourth-quarter call about outsize numbers of non-Covid-19 deaths in 2022. “Some of these will be the result of delayed medical care or the increased incidence of societal-related issues, such as the increased prevalence of substance abuse,” Chief Financial Officer Alison Rand said in an email interview.

From early stages of the pandemic, many medical professionals have raised concerns about Americans’ untreated health problems, as Covid-19 put stress on the nation’s healthcare system.

Author(s): Leslie Scism

Publication Date: 23 Feb 2022

Publication Site: WSJ

Mortality Angle of the Russian/Ukrainian Conflict: Bad Even Before Pandemic

Link: https://marypatcampbell.substack.com/p/mortality-angle-of-the-russianukrainian?utm_source=url

Graphic:

Excerpt:

These are awful trends. There’s nothing to caveat. Yes, Ukraine’s life expectancy is a little bit higher, but these numbers are awful, and yes, there was a cratering of male life expectancy after the collapse of the Soviet Union.

I will note that there was a general slide from the early 1960s until the early 1980s… a run-up for some reason (falsifying data?), and then absolute cratering. That’s just hideous.

Dropping about 5 years over a 5-year period is a horrible decrease.

There has been a recovery since 2004, but that life expectancy is still very low compared to other European countries, even other Eastern European countries, as we’ll see below.

Author(s): Mary Pat Campbell

Publication Date: 27 Feb 2022

Publication Site: STUMP at substack

Geography of Mortality: State Ranking by Increase in Total Mortality and COVID Mortality, 2020-2021, Provisional

Link: https://marypatcampbell.substack.com/p/geography-of-mortality-state-ranking

Graphic:

Video:

Excerpt:

With this tile grid map, we can see that the two-year mortality experience has been horrible, even on an age-adjusted basis. I will be using age-adjusted death rates [using the standard 2000-reference-age-adjustment] for all the comparisons. The methodology is at the end of the post.

I warn against taking any meaning from North Carolina, as it has a data-reporting problem. Hawaii, however, really does have a low increase in mortality, and I believe it is credible that the mortality increase of the northeast is also low. I am not sure how credibly to take the increase in mortality of Wyoming, given its relatively small population.

However, we can see some patterns. In general, one has a “hot spot”, and then the increase falls off as you retreat from that peak. The large pattern is the high increase along the southern border — Arizona, New Mexico, Texas, Mississippi — and then the next layer above is less bad, and so forth. There is the Wyoming peak, falls off around there. There is the midwest cluster – Illinois, Michigan, Indiana, Ohio. And then New York/New Jersey.

As well we know, the excess mortality is driven primarily by COVID, which I will get to in the next major section, but let me share some ranking tables.

Author(s): Mary Pat Campbell

Publication Date: 23 Feb 2022

Publication Site: STUMP at substack

Underdispersion in the reported Covid-19 case and death numbers may suggest data manipulations

Link: https://www.medrxiv.org/content/10.1101/2022.02.11.22270841v1

doi: https://doi.org/10.1101/2022.02.11.22270841

Graphic:

Abstract:

We suggest a statistical test for underdispersion in the reported Covid-19 case and death numbers, compared to the variance expected under the Poisson distribution. Screening all countries in the World Health Organization (WHO) dataset for evidence of underdispersion yields 21 country with statistically significant underdispersion. Most of the countries in this list are known, based on the excess mortality data, to strongly undercount Covid deaths. We argue that Poisson underdispersion provides a simple and useful test to detect reporting anomalies and highlight unreliable data.

Author(s): Dmitry Kobak

Publication Date: 13 Feb 2022

Publication Site: medRXiV

Are some countries faking their covid-19 death counts?

Link: https://www.economist.com/graphic-detail/2022/02/25/are-some-countries-faking-their-covid-19-death-counts

Graphic:

Excerpt:

Irregular statistical variation has proven a powerful forensic tool for detecting possible fraud in academic research, accounting statements and election tallies. Now similar techniques are helping to find a new subgenre of faked numbers: covid-19 death tolls.

That is the conclusion of a new study to be published in Significance, a statistics magazine, by the researcher Dmitry Kobak. Mr Kobak has a penchant for such studies—he previously demonstrated fraud in Russian elections based on anomalous tallies from polling stations. His latest study examines how reported death tolls vary over time. He finds that this variance is suspiciously low in a clutch of countries—almost exclusively those without a functioning democracy or a free press.

Mr Kobak uses a test based on the “Poisson distribution”. This is named after a French statistician who first noticed that when modelling certain kinds of counts, such as the number of people who enter a railway station in an hour, the distribution takes on a specific shape with one mathematically pleasing property: the mean of the distribution is equal to its variance.

This idea can be useful in modelling the number of covid deaths, but requires one extension. Unlike a typical Poisson process, the number of people who die of covid can be correlated from one day to the next—superspreader events, for example, lead to spikes in deaths. As a result, the distribution of deaths should be what statisticians call “overdispersed”—the variance should be greater than the mean. Jonas Schöley, a demographer not involved with Mr Kobak’s research, says he has never in his career encountered death tallies that would fail this test.

….

The Russian numbers offer an example of abnormal neatness. In August 2021 daily death tallies went no lower than 746 and no higher than 799. Russia’s invariant numbers continued into the first week of September, ranging from 792 to 799. A back-of-the-envelope calculation shows that such a low-variation week would occur by chance once every 2,747 years.

Publication Date: 25 Feb 2022

Publication Site: The Economist

Tracking covid-19 excess deaths across countries

Link: https://www.economist.com/graphic-detail/coronavirus-excess-deaths-tracker?utm_campaign=a.coronavirus-special-edition&utm_medium=email.internal-newsletter.np&utm_source=salesforce-marketing-cloud&utm_term=20220219&utm_content=ed-picks-article-link-6&etear=nl_special_6&utm_campaign=a.coronavirus-special-edition&utm_medium=email.internal-newsletter.np&utm_source=salesforce-marketing-cloud&utm_term=2/19/2022&utm_id=1055648

Graphic:

Excerpt:

As covid-19 has spread around the world, people have become grimly familiar with the death tolls that their governments publish each day. Unfortunately, the total number of fatalities caused by the pandemic may be even higher, for several reasons. First, the official statistics in many countries exclude victims who did not test positive for coronavirus before dying—which can be a substantial majority in places with little capacity for testing. Second, hospitals and civil registries may not process death certificates for several days, or even weeks, which creates lags in the data. And third, the pandemic has made it harder for doctors to treat other conditions and discouraged people from going to hospital, which may have indirectly caused an increase in fatalities from diseases other than covid-19.

Publication Date: Accessed 21 Feb 2022

Publication Site: The Economist

Study: Fewer crashes after Utah sets strictest DUI law in US

Link: https://www.ny1.com/nyc/all-boroughs/ap-online/2022/02/11/study-fewer-crashes-after-utah-set-strictest-dui-law-in-us

Graphic:

Excerpt:

Traffic deaths decreased in Utah after the state enacted the strictest drunken driving laws in the nation five years ago, new research published Friday by a U.S. government agency shows.

The findings, which pertain to fatalities involving and not involving alcohol, provide initial validation for conservative lawmakers who passed the law over concerns from restaurant and tourism industry lobbyists.

In the study published by the National Highway Traffic Safety Administration, researchers wrote that, in the years after Utah changed the drunken driving threshold from .08% to .05% blood-alcohol content, the number of crashes and fatalities fell even though drivers logged more miles.

“Changing the law to .05% in Utah saved lives and motivated more drivers to take steps to avoid driving impaired,” said Dr. Steven Cliff, the agency’s deputy administrator.

The findings mark a triumph for Utah’s Republican-controlled Legislature, which voted to decrease the legal limit in 2017 over concerns that it would discourage prospective new residents and tourists.

They and other opponents argued it would be ineffective and cement Utah’s pious reputation at the expense of the growing number of visitors and residents who aren’t part of the Church of Jesus Christ of Latter-day Saints.

Utah, where about 60% of the population are members of the faith, has long enforced some of the nation’s strictest liquor laws.

Author(s): Associated Press

Publication Date: 11 Feb 2022

Publication Site: NY1

Vehicle Crashes, Surging

Link: https://www.nytimes.com/2022/02/15/briefing/vehicle-crashes-deaths-pandemic.html

Graphic:

Excerpt:

Per capita vehicle deaths rose 17.5 percent from the summer of 2019 to last summer, according to a Times analysis of federal data. It is the largest two-year increase since just after World War II.

….

Rising drug abuse during the pandemic seems to play an important role, as well. The U.S. Department of Transportation has reported that “the proportion of drivers testing positive for opioids nearly doubled after mid-March 2020, compared to the previous 6 months, while marijuana prevalence increased by about 50 percent.” (Mid-March 2020 is when major Covid mitigations began.)

….

Vehicle crashes might seem like an equal-opportunity public health problem, spanning racial and economic groups. Americans use the same highways, after all, and everybody is vulnerable to serious accidents. But they are not equally vulnerable.

Traffic fatalities are much more common in low-income neighborhoods and among Native and Black Americans, government data shows. Fatalities are less common among Asian Americans. (The evidence about Latinos is mixed.) There are multiple reasons, including socioeconomic differences in vehicle quality, road conditions, substance abuse and availability of crosswalks.

Author(s): David Leonhardt

Publication Date: 15 Feb 2022

Publication Site: NYT

2021 Academy Legislative/Regulatory Review

Link: https://www.actuary.org/sites/default/files/members/alerts/pdf/2022/2022-CP-1.pdf

Excerpt:

The American Academy of Actuaries presents this summary of select significant regulatory and
legislative developments in 2021 at the state, federal, and international levels of interest to the U.S.
actuarial profession as a service to its members.

Introduction

The Academy focused on key policy debates in 2021 regarding pensions and retirement, health, life,
and property and casualty insurance, and risk management and financial reporting.


Responding to the COVID-19 pandemic, addressing ever-changing cyber risk concerns, and analyzing
the implications and actuarial impacts of data science modeling continued to be a focus in 2021.


Practice councils monitored and responded to numerous legislative developments at the state, federal,
and international level. The Academy also increased its focus on the varied impacts of climate risk and
public policy initiatives related to racial equity and unfair discrimination in 2021.


The Academy continues to track the progress of legislative and regulatory developments on actuarially
relevant issues that have carried over into the 2022 calendar year.

Publication Date: 15 Feb 2022

Publication Site: American Academy of Actuaries

US road deaths rise at record pace as risky driving persists

Link: https://apnews.com/article/coronavirus-pandemic-business-health-transportation-pete-buttigieg-a16719e38d72f68e338030103e924cf0

Excerpt:

The number of U.S. traffic deaths surged in the first nine months of 2021 to 31,720, the government reported Tuesday, keeping up a record pace of increased dangerous driving during the coronavirus pandemic.

The estimated figure of people dying in motor vehicle crashes from January to September 2021 was 12% higher than the same period in 2020. That represents the highest percentage increase over a nine-month period since the Transportation Department began recording fatal crash data in 1975.

The tally of 31,720 deaths was the highest nine-month figure since 2006.

Federal data from the department’s National Highway Traffic Safety Administration showed that traffic fatalities increased during the nine-month period in 38 states, led by those in the West and South such as Idaho, Nevada and Texas, and was flat in two states. The numbers declined in 10 states and the District of Columbia.

Author(s): Hope Yen

Publication Date: 1 Feb 2022

Publication Site: Associated Press