The Society of Actuaries (SOA) Research Institute’s Mortality and Longevity Strategic Research Program Steering Committee issued a call for essays to explore the application of artificial intelligence (AI) to mortality and longevity. The objective was to gather a variety of perspectives and experiences on the use of AI in mortality modeling, forecasting and prediction to promote discussion and future research around this topic.
The collection includes six essays that were accepted for publication from all submissions. Two essays were chosen for prizes based on their creativity, originality, and likelihood of further thought on the subject matter.
Author(s): multiple
Publication Date: September 2024
Publication Site: Society of Actuaries, SOA Research Institute
This paper describes the use and professionalism considerations for actuaries using generative artificial intelligence (GenAI) to provide actuarial services. GenAI generates text, quantitative, or image content based on training data, typically using a large language model (LLM). Examples of GenAI deployments include Open AI GPT, Google Gemini, Claude, and Meta. GenAI transforms information acquired from training data into entirely new content. In contrast, predictive AI models analyze historical quantitative data to forecast future outcomes, functioning like traditional predictive statistical models.
Actuaries have a wide range of understanding of AI. We assume the reader is broadly familiar with AI and AI model capabilities, but not necessarily a designer or expert user. In this paper, the terms “GenAI,” “AI,” “AI model(s),” and “AI tool(s)” are used interchangeably. This paper covers the professionalism fundamentals of using GenAI and only briefly discusses designing, building, and customizing GenAI systems. This paper focuses on actuaries using GenAI to support actuarial conclusions, not on minor incidental use of AI that duplicates the function of tools such as plug-ins, co-pilots, spreadsheets, internet search engines, or writing aids.
GenAI is a recent development, but the actuarial professionalism framework helps actuaries use GenAI appropriately: the Code of Professional Conduct, the Qualification Standards for Actuaries Issuing Statements of Actuarial Opinion in the United States (USQS), and the actuarial standards of practice (ASOPs). Although ASOP No. 23, Data Quality; No. 41, Actuarial Communications; and No. 56, Modeling, were developed before GenAI was widely available, each applies in situations when GenAI may now be used. The following discussion comments on these topics, focusing extensively on the application of ASOP No. 56, which provides guidance for actuaries when they are designing, developing, selecting, modifying, using, reviewing, or evaluating models. GenAI is a model; thus ASOP No. 56 applies.
The paper explores use cases and addresses conventional applications, including quantitative and qualitative analysis, as of mid-2024, rather than anticipating novel uses or combinations of applications. AI tools change quickly, so the paper focuses on principles rather than the technology. The scope of this paper does not include explaining how AI models are structured or function, nor does it offer specific guidelines on AI tools or use by the actuary in professional settings. Given the rapid rate of change within this space, the paper makes no predictions about the rapidly evolving technology, nor does it speculate on future challenges to professionalism.
Author(s): Committee on Professional Responsibility of the American Academy of Actuaries
Committee on Professional Responsibility Geoffrey C. Sandler, Chairperson Brian Donovan Richard Goehring Laura Maxwell Shawn Parks Matthew Wininger Kathleen Wong Yukki Yeung Paul Zeisler Melissa Zrelack
Artificial Intelligence Task Force Prem Boinpally Laura Maxwell Shawn Parks Fei Wang Matt Wininger Kathy Wong Yukki Yeung
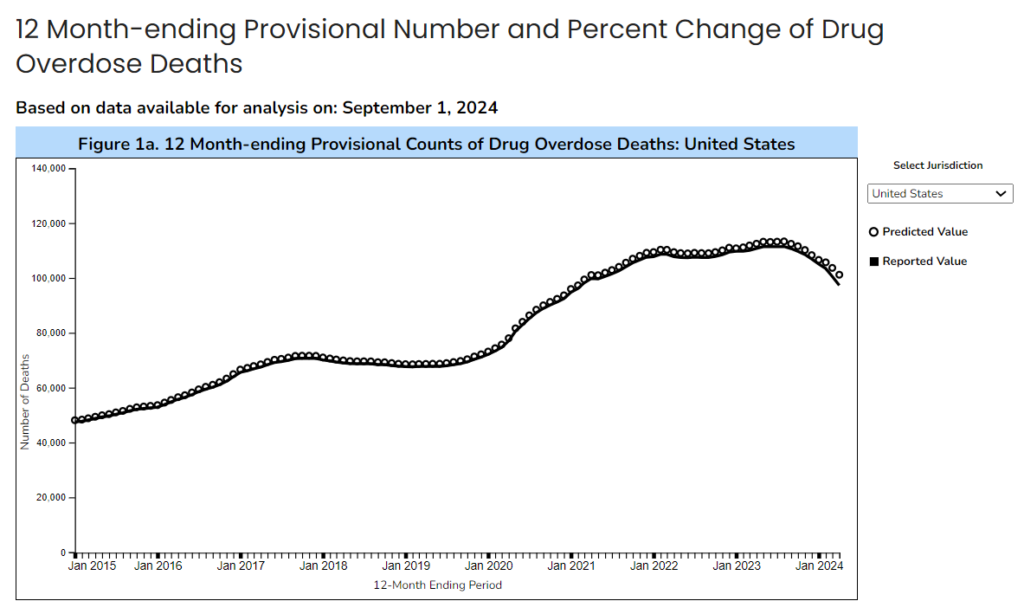
This data visualization presents provisional counts for drug overdose deaths based on a current flow of mortality data in the National Vital Statistics System. Counts for the most recent final annual data are provided for comparison. National provisional counts include deaths occurring within the 50 states and the District of Columbia as of the date specified and may not include all deaths that occurred during a given time period. Provisional counts are often incomplete and causes of death may be pending investigation (see Technical notes) resulting in an underestimate relative to final counts. To address this, methods were developed to adjust provisional counts for reporting delays by generating a set of predicted provisional counts (see Technical notes).
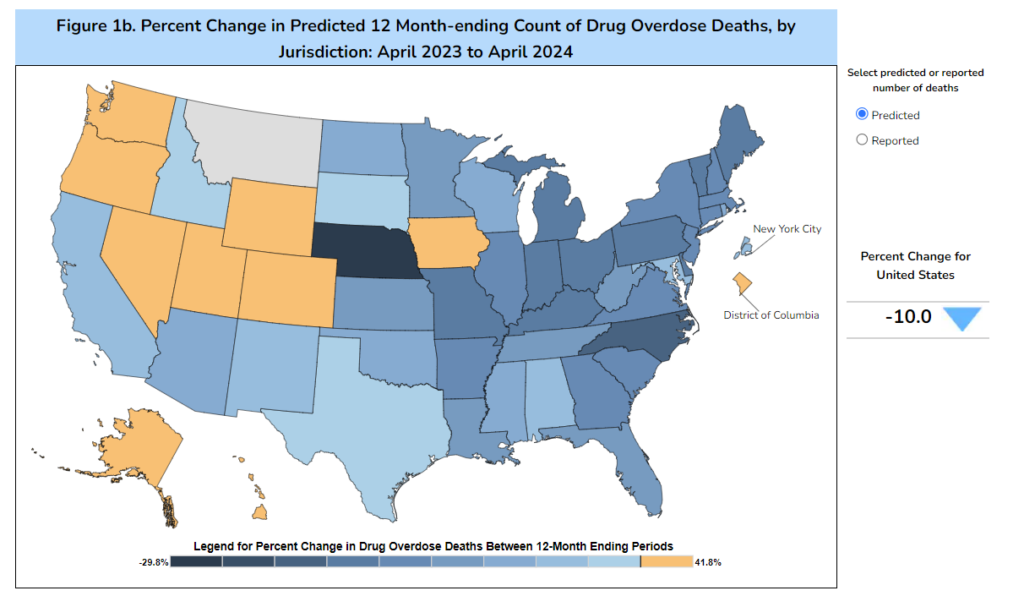
The provisional data presented in this visualization include: (a) the reported and predicted provisional counts of deaths due to drug overdose occurring nationally and in each jurisdiction; (b) a U.S. map of the percentage changes in provisional drug overdose deaths for the current 12 month-ending period compared with the 12-month period ending in the same month of the previous year, by jurisdiction; and (c) the reported and predicted provisional counts of drug overdose deaths involving specific drugs or drug classes occurring nationally and in selected jurisdictions. The reported and predicted provisional counts represent the numbers of deaths due to drug overdose occurring in the 12-month periods ending in the month indicated. These counts include all seasons of the year and are insensitive to variations by seasonality. Deaths are reported by the jurisdiction in which the death occurred.
Several data quality metrics, including the percent completeness in overall death reporting, percentage of deaths with cause of death pending further investigation, and the percentage of drug overdose deaths with specific drugs or drug classes reported are included to aid in interpretation of provisional data as these measures are related to the accuracy of provisional counts (see Technical notes). Reporting of the specific drugs and drug classes involved in drug overdose deaths varies by jurisdiction, and comparisons of death rates involving specific drugs across selected jurisdictions should not be made (see Technical notes). Provisional data presented in this visualization will be updated on a monthly basis as additional records are received.
Publication Date: Accessed 19 Sept 2024
Publication Site: National Center for Health Statistics, CDC
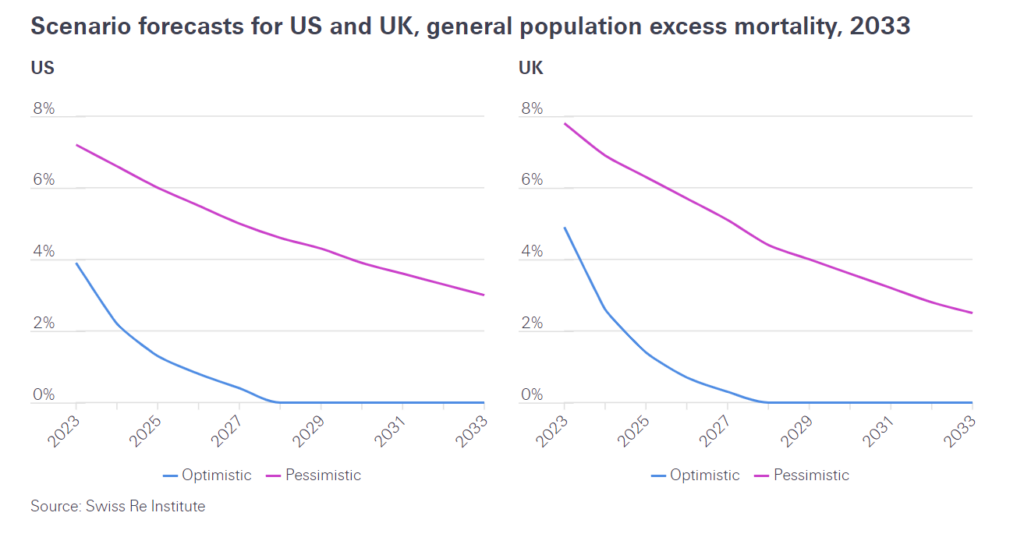
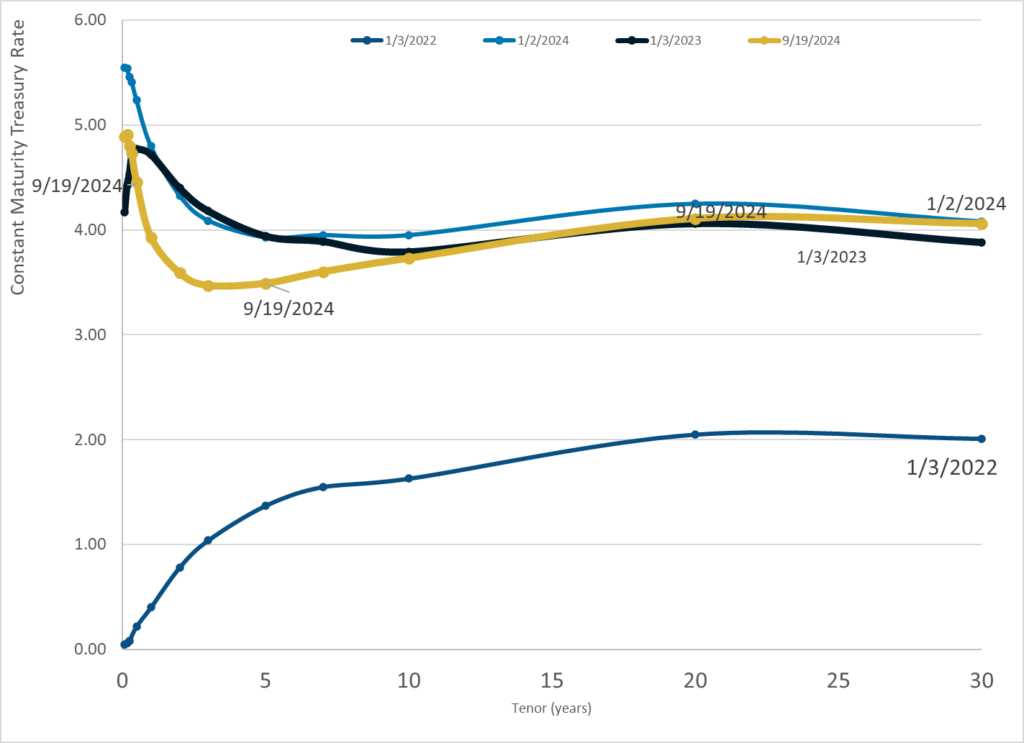
Four years on from the outbreak of the pandemic in 2020, many countries worldwide still report elevated deaths in their populations. This impact appears generally independent of healthcare systems and population health. This trend is evident even after accounting for shifting population sizes, and the range of reporting mechanisms and death classifications that make inter-country comparisons complex. There is also likely a degree of excess mortality under-reporting.
Quantifying excess mortality has been an acute challenge since 2020 due to the exceptional mortality rates of the pandemic. Excess mortality refers to the number of deaths over and above an assumed “expected” number of deaths. The different methods of estimating expected mortality can generate very different excess mortality rates.
This represents a potential challenge for Life and Health (L&H) insurance, with potentially several years of elevated mortality claims ahead, depending on how general population trends translate into the insured population. Ongoing excess mortality can have implications for L&H insurance claims and reserves. Excess mortality that continues to exceed current expectations may affect the long-term performance of in-force life portfolios as well as the pricing of new life policies.
Author(s): By Daniel Meier, Life & Health R&D Manager, CUO L&H Reinsurance & Prachi Patkee, Life & Health R&D Analyst, CUO L&H Reinsurance & Adam Strange, Life & Health R&D Manager, CUO L&H Reinsurance
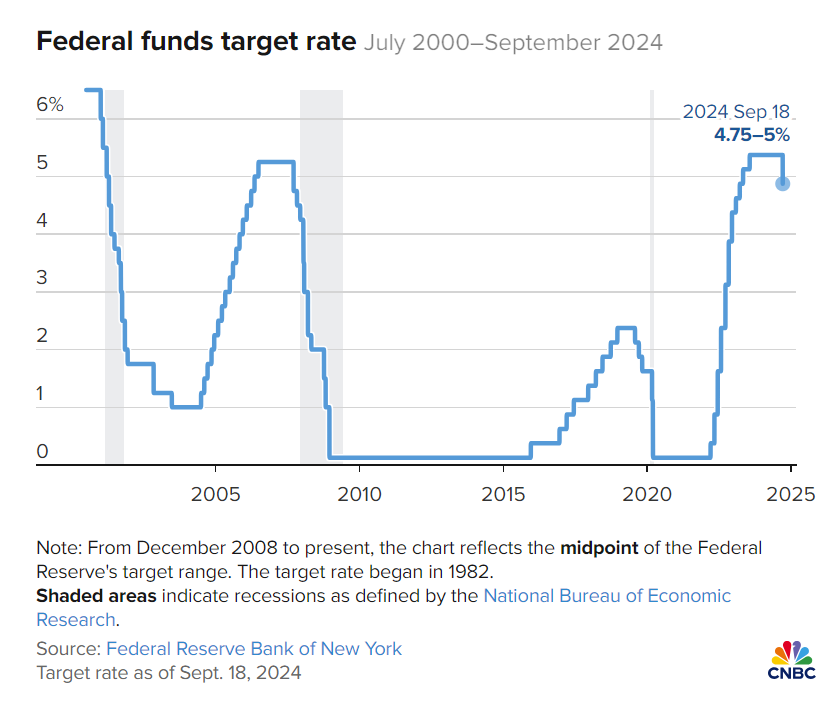
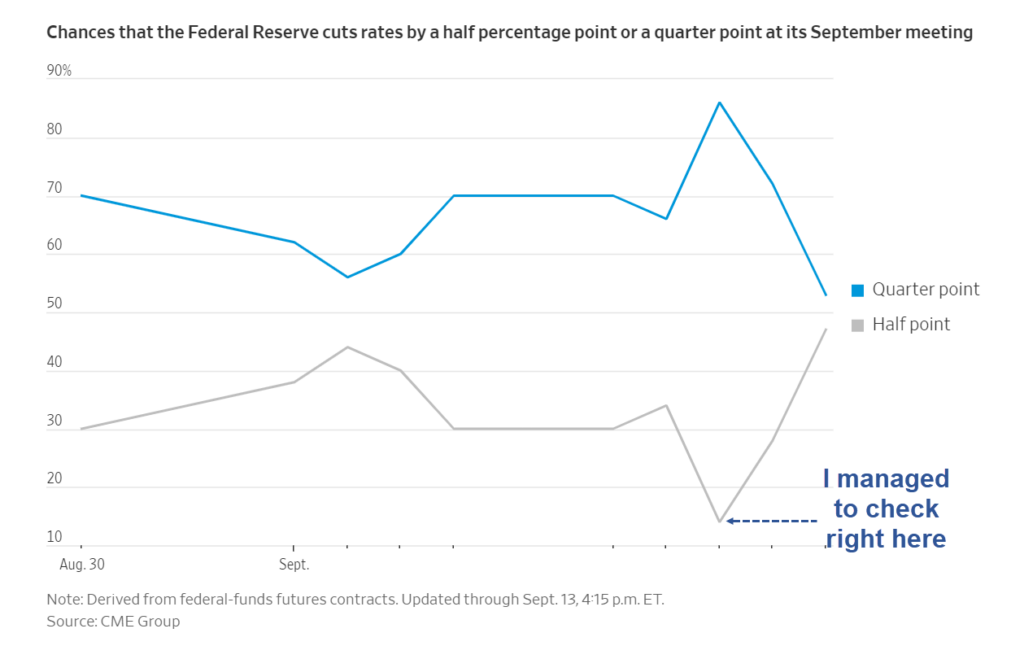
WASHINGTON – The Federal Reserve on Wednesday enacted its first interest rate cut since the early days of the Covid pandemic, slicing half a percentage point off benchmark rates in an effort to head off a slowdown in the labor market.
With both the jobs picture and inflation softening, the central bank’s Federal Open Market Committee chose to lower its key overnight borrowing rate by a half percentage point, or 50 basis points, affirming market expectations that had recently shifted from an outlook for a cut half that size.
Outside of the emergency rate reductions during Covid, the last time the FOMC cut by half a point was in 2008 during the global financial crisis.
The decision lowers the federal funds rate to a range between 4.75%-5%. While the rate sets short-term borrowing costs for banks, it spills over into multiple consumer products such as mortgages, auto loans and credit cards.
In addition to this reduction, the committee indicated through its “dot plot” the equivalent of 50 more basis points of cuts by the end of the year, close to market pricing. The matrix of individual officials’ expectations pointed to another full percentage point in cuts by the end of 2025 and a half point in 2026. In all, the dot plot shows the benchmark rate coming down about 2 percentage points beyond Wednesday’s move.
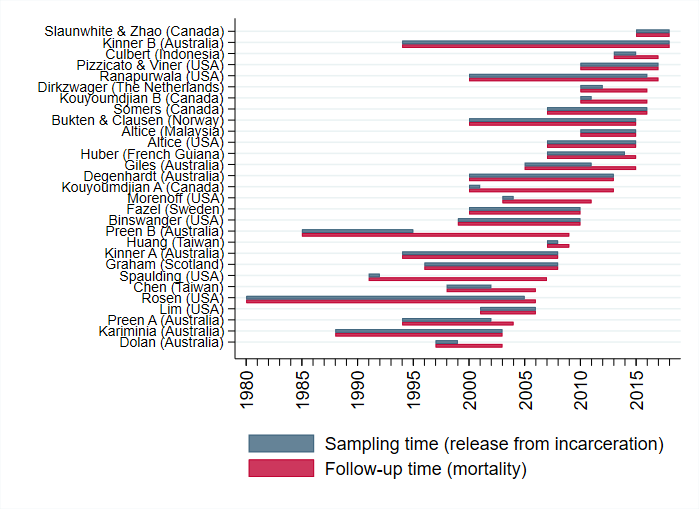
Introduction More than 30 million adults are released from incarceration globally each year. Many experience complex physical and mental health problems, and are at markedly increased risk of preventable mortality. Despite this, evidence regarding the global epidemiology of mortality following release from incarceration is insufficient to inform the development of targeted, evidence-based responses. Many previous studies have suffered from inadequate power and poor precision, and even large studies have limited capacity to disaggregate data by specific causes of death, sub-populations or time since release to answer questions of clinical and public health relevance.
Objectives To comprehensively document the incidence, timing, causes and risk factors for mortality in adults released from prison.
Methods We created the Mortality After Release from Incarceration Consortium (MARIC), a multi-disciplinary collaboration representing 29 cohorts of adults who have experienced incarceration from 11 countries. Findings across cohorts will be analysed using a two-step, individual participant data meta-analysis methodology.
Results The combined sample includes 1,337,993 individuals (89% male), with 75,795 deaths recorded over 9,191,393 person-years of follow-up.
Conclusions The consortium represents an important advancement in the field, bringing international attention to this problem. It will provide internationally relevant evidence to guide policymakers and clinicians in reducing preventable deaths in this marginalized population.
Author(s): Borschmann, R., Tibble, H., Spittal, M. J., Preen, D., Pirkis, J., Larney, S., Rosen, D. L., Young, J. T., Love, A. D., Altice, F. L., Binswanger, I. A., Bukten, A., Butler, T., Chang, Z., Chen, C.-Y., Clausen, T., Christensen, P. B., Culbert, G. J., Degenhardt, L., Dirkzwager, A. J., Dolan, K., Fazel, S., Fischbacher, C., Giles, M., Graham, L., Harding, D., Huang, Y.-F., Huber, F., Karaminia, A., Kouyoumdjian, F. G., Lim, S., Møller, L., Moniruzzaman, A., Morenoff, J., O’Moore, E., Pizzicato, L. N., Pratt, D., Proescholdbell, S. F., Ranapurwala, S. I., Shanahan, M. E., Shaw, J., Slaunwhite, A., Somers, J. M., Spaulding, A. C., Stern, M. F., Viner, K. M., Wang, N., Willoughby, M., Zhao, B. and Kinner, S. A.
Publication Date: February 2020
Publication Site: International Journal of Population Data Science
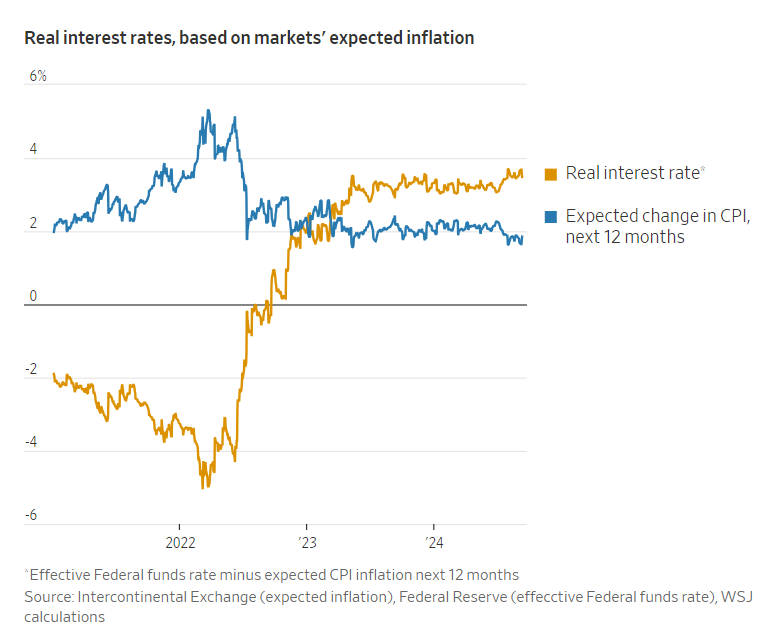
A year ago inflation as measured by the consumer-price index was 3.2%. In August, it was 2.5%. In that time, core inflation, which excludes food and energy, has fallen from 4.2% to an estimated 2.7%, using the Fed’s preferred gauge, the price index of personal-consumption expenditures, or PCE.
The gap between 2.7% and the Fed’s 2% target largely reflects the lagged effects of higher housing, auto and other prices from a few years ago. Some alternative indexes attempt to exclude such idiosyncratic factors. Harvard University economist Jason Furman averages several over different time horizons to yield a single, PCE-equivalent underlying inflation rate. It was 2.2% in August, the lowest since early 2021.
Inflation is likely to keep falling. Oil has plunged from $83 a barrel in early July to below $70 on Friday. This will directly lower headline inflation and, indirectly, core inflation because oil is an input into almost every business. A study by Robert Minton, now at the Fed, and Brian Wheaton at the University of California, Los Angeles, found oil can explain 16% of fluctuations in core inflation, and it takes two years for 80% of the effect to show up.