We suggest a statistical test for underdispersion in the reported Covid-19 case and death numbers, compared to the variance expected under the Poisson distribution. Screening all countries in the World Health Organization (WHO) dataset for evidence of underdispersion yields 21 country with statistically significant underdispersion. Most of the countries in this list are known, based on the excess mortality data, to strongly undercount Covid deaths. We argue that Poisson underdispersion provides a simple and useful test to detect reporting anomalies and highlight unreliable data.
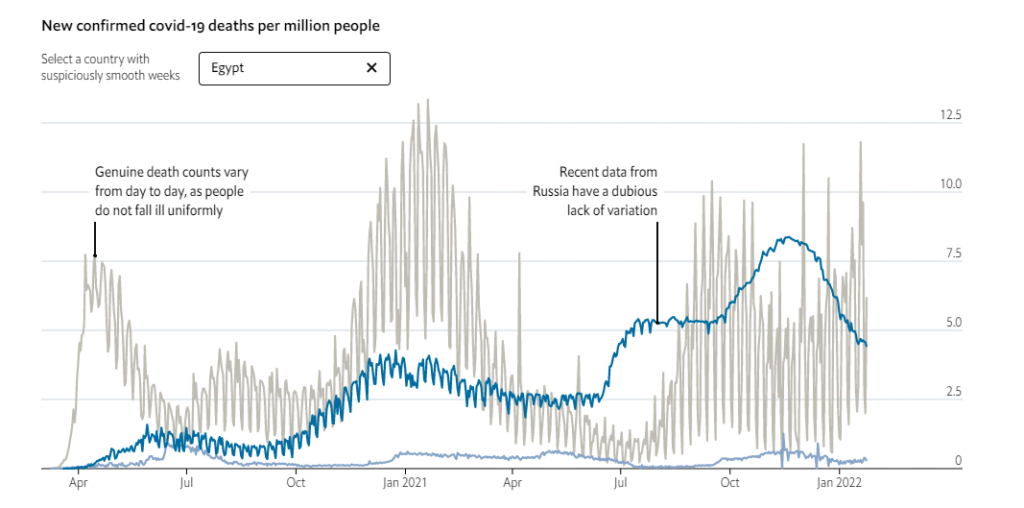
Irregular statistical variation has proven a powerful forensic tool for detecting possible fraud in academic research, accounting statements and election tallies. Now similar techniques are helping to find a new subgenre of faked numbers: covid-19 death tolls.
That is the conclusion of a new study to be published in Significance, a statistics magazine, by the researcher Dmitry Kobak. Mr Kobak has a penchant for such studies—he previously demonstrated fraud in Russian elections based on anomalous tallies from polling stations. His latest study examines how reported death tolls vary over time. He finds that this variance is suspiciously low in a clutch of countries—almost exclusively those without a functioning democracy or a free press.
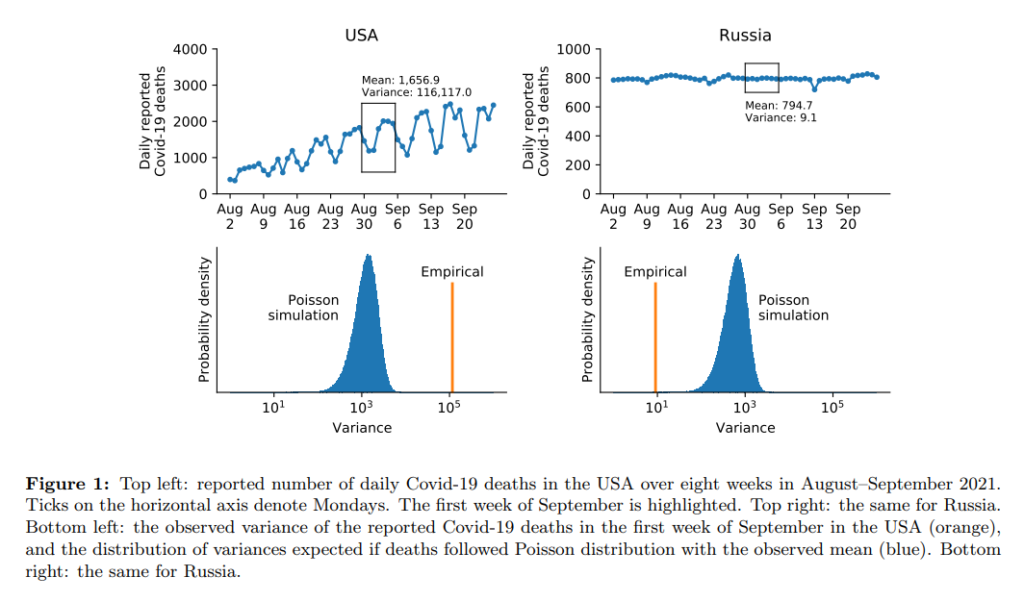
Mr Kobak uses a test based on the “Poisson distribution”. This is named after a French statistician who first noticed that when modelling certain kinds of counts, such as the number of people who enter a railway station in an hour, the distribution takes on a specific shape with one mathematically pleasing property: the mean of the distribution is equal to its variance.
This idea can be useful in modelling the number of covid deaths, but requires one extension. Unlike a typical Poisson process, the number of people who die of covid can be correlated from one day to the next—superspreader events, for example, lead to spikes in deaths. As a result, the distribution of deaths should be what statisticians call “overdispersed”—the variance should be greater than the mean. Jonas Schöley, a demographer not involved with Mr Kobak’s research, says he has never in his career encountered death tallies that would fail this test.
….
The Russian numbers offer an example of abnormal neatness. In August 2021 daily death tallies went no lower than 746 and no higher than 799. Russia’s invariant numbers continued into the first week of September, ranging from 792 to 799. A back-of-the-envelope calculation shows that such a low-variation week would occur by chance once every 2,747 years.
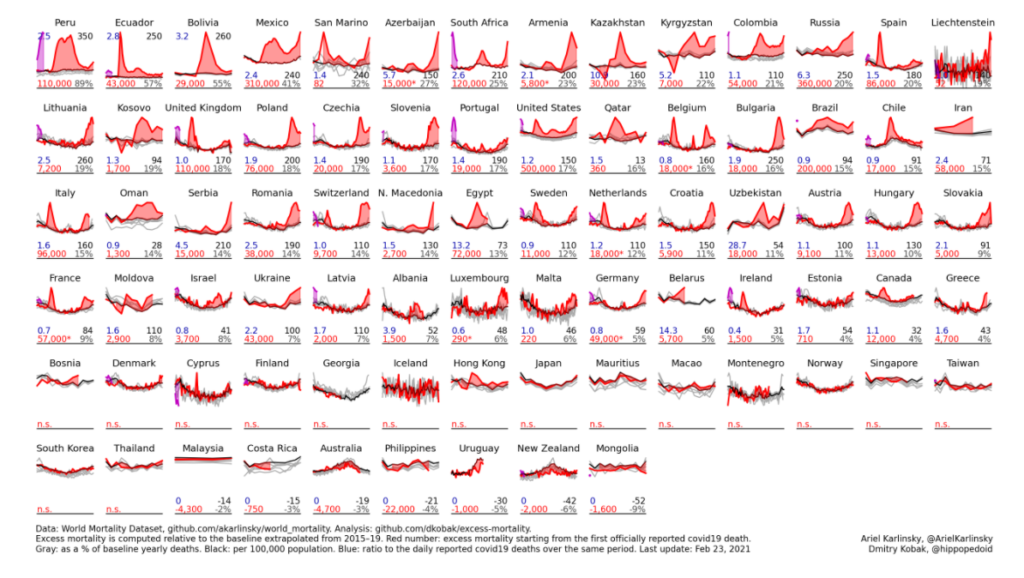
The data are sourced from the World Mortality Dataset. Excess mortality is computed relative to the baseline obtained using linear extrapolation of the 2015–19 trend. In the figure below, gray lines are 2015–19, black line is baseline for 2020, red line is 2020, purple line is 2021. Countries are sorted by the % increase over the baseline.
Red number: excess mortality starting from the first officially reported Covid-19 death. Gray number: excess mortality as a % of the annual baseline deaths. Black number: excess mortality per 100,000 population. Blue number: ratio to the daily reported Covid-19 deaths over the same period (sourced from JHU).
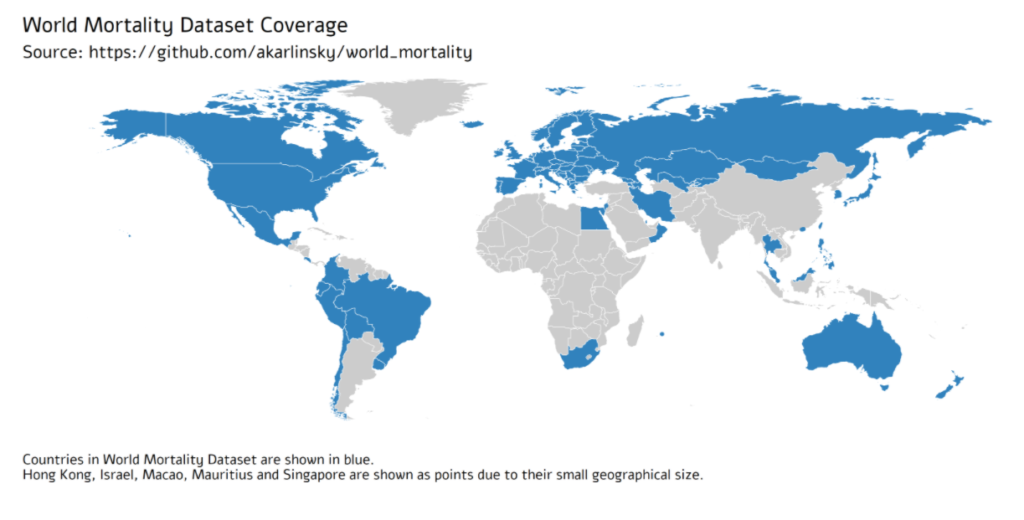
Comparing the impact of the COVID-19 pandemic between countries or across time is difficult because the reported numbers of cases and deaths can be strongly affected by testing capacity and reporting policy. Excess mortality, defined as the increase in all-cause mortality relative to the recent average, is widely considered as a more objective indicator of the COVID-19 death toll. However, there has been no central, frequently-updated repository of the all-cause mortality data across countries. To fill this gap, we have collected weekly, monthly, or quarterly all-cause mortality data from 77 countries, openly available as the regularly-updated World Mortality Dataset. We used this dataset to compute the excess mortality in each country during the COVID-19 pandemic. We found that in the worst-affected countries the annual mortality increased by over 50%, while in several other countries it decreased by over 5%, presumably due to lockdown measures decreasing the non-COVID mortality. Moreover, we found that while some countries have been reporting the COVID-19 deaths very accurately, many countries have been underreporting their COVID-19 deaths by an order of magnitude or more. Averaging across the entire dataset suggests that the world’s COVID-19 death toll may be at least 1.6 times higher than the reported number of confirmed deaths.