Link:https://manhattan.institute/article/the-limits-of-taxing-the-rich
Graphic:
Excerpt:
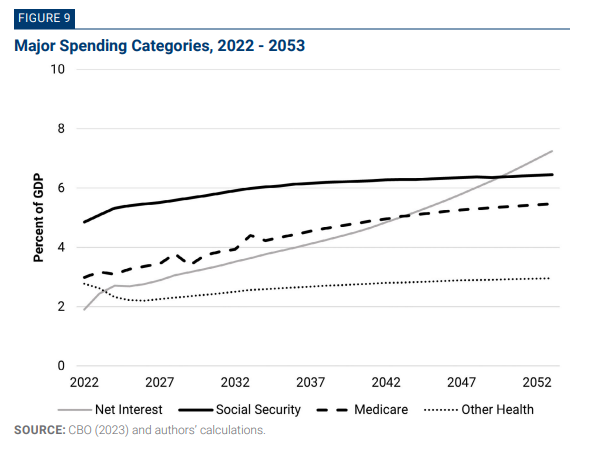
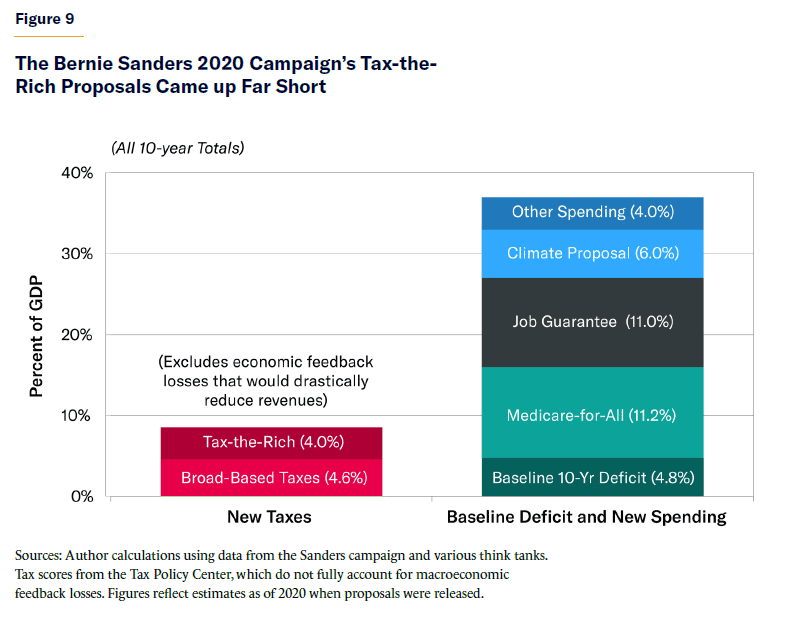
Sanders’s agenda is not limited to taxes on corporations and wealthy families. The campaign also proposed to partially finance Medicare-for-All through 4.6% of GDP in new tax revenues from broad-based payroll taxes and tax-preference eliminations (within health care). However, even if one uses the inflated revenue figure of 8.6% of GDP (4.0% from the wealthy and 4.6% from broad-based taxes), it still falls far short of financing Sanders’s spending promises. Sanders proposed $23 trillion in new taxes over the 2021–30 period, yet also proposed a $30 trillion Medicare-for-All plan, $30 trillion government job guarantee, $16 trillion climate initiative, and $11 trillion for free public college tuition, full student-loan forgiveness, Social Security expansion, housing, infrastructure, paid family leave, and K–12 education. That is $87 trillion in spending promises, on top of a baseline budget deficit that, at the time, was forecast at $13 trillion over the decade.[104] Even the rosiest revenue estimates of Sanders’s tax policies would cover only a small fraction of his spending promises (see Figure 9).
At the same time, Sanders has obfuscated the funding shortfall by: 1) regularly claiming that his tax policies can cover all his spending promises, even as official scores show otherwise; and 2) proposing most spending increases separately, in order to make each one appear individually affordable within his broader tax agenda.
Summary: Some progressives suggest that Bernie Sanders has identified extraordinary potential revenues from taxing the rich. However, his proposed tax increases on corporations and wealthy individuals show revenues of 4% of GDP—and that is before accounting for constitutional challenges and unrealistic tax rates that far exceed the consensus of revenue-maximizing rates. Given behavioral and economic responses, the total potential tax revenues are (at most) 2% of GDP, and possibly far less. Indeed, leading progressive tax officials assume plausible tax rates and revenues far below those of Sanders’s proposals. Even assuming Sanders’s full static revenue estimate and including his steep middle-class tax proposals would not come close to paying for his spending agenda. The contention that Sanders has unlocked an enormous tax-the-rich revenue source is false.
Author(s): Brian Riedl
Publication Date: 21 Sept 2023
Publication Site: Manhattan Institute