A Widening Gap in Life Expectancy Makes Raising Social Security’s Retirement Age a Particularly Bad Deal for Low-Wage Earners

Link: https://sections.soa.org/publication/?m=58953&i=668685&view=articleBrowser&article_id=3731911&ver=html5

Graphic:

Excerpt:

Many recent studies find the life expectancy gap is growing. By how much depends on how and when it’s measured. In 2014, the Congressional Budget Office (CBO) calculated that a 65-yearold man in the upper quintile (fifth) of life earnings could be expected to live more than three years longer than a similar man in the lowest quintile. By 2039, the difference would double to six years.

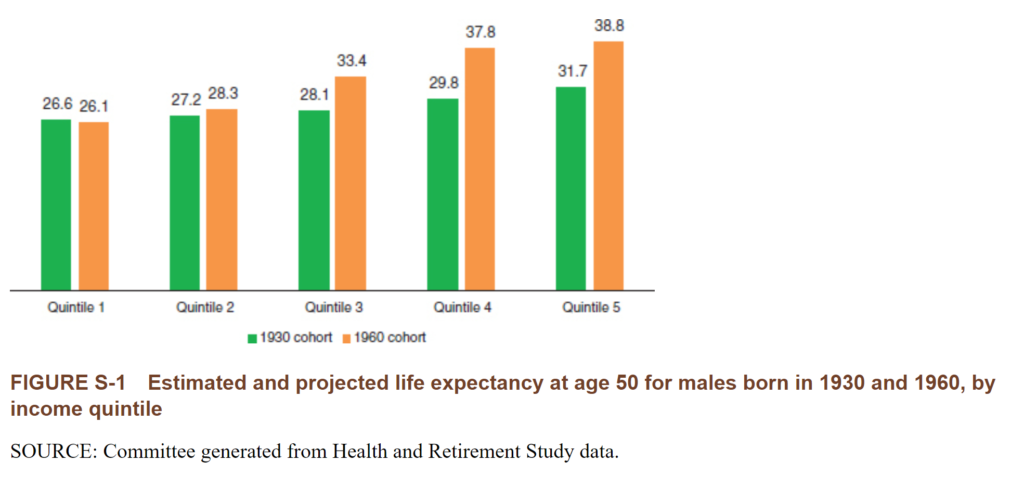
In a 2015 report, the National Academy of Sciences compared the 1930 and 1960 birth cohorts and found that life expectancy for the bottom quintile of men at age 50 decreased slightly to 26.1 years over the 30-year period. Meanwhile, life expectancy rose for men age 50 in higher-income quintiles. As shown in Figure 1, the life expectancy gap between the bottom (quintile 1) and top fifth of the income distribution widened from 5.1 to 12.7 years. In 2016, a Brookings study found, for men born in 1940, those in the lowest income decile at age 50 could expect to live to be about 76 years old compared with 88 years for the highest income decile. Another research team, led by Raj Chetty, found that disparity in longevity continued to increase over 2001–2014; the average gap between the bottom and top 1 percent was 14.6 years for men and 10.1 years for women.

Author(s): Karl Polzer

Publication Date: August 2020

Publication Site: In the Public Interest, SOA

EXECUTIVE EXCESS 2022

Link: https://ips-dc.org/report-executive-excess-2022/

Graphic:

Excerpt:

  • Taxpayer dollars are fueling corporations with extreme CEO-worker pay gaps.
    • Of the 300 companies in our sample, 40 percent received federal contracts between October 1, 2019 and May 1, 2022. The combined value of these contracts was $37.2 billion.
    • At these low-wage contractors, the average CEO-worker pay ratio hit 571 to 1 in 2021. Only 6 of the 119 contractors had pay gaps of less than 100 to 1.
  • Policy solutions for runaway CEO pay do exist — and enjoy broad support.
    • Some 62 percent of Republicans and 75 percent of Democrats support an outright cap on CEO pay relative to worker pay.
    • While a hard cap is unlikely, other CEO pay reforms have also gained traction in recent years. These reforms focus on three key areas:
      • CEO pay ratio incentives for federal contractors
      • Excessive CEO pay taxes
      • Stock buyback restrictions and taxes

Author(s): SARAH ANDERSON | SAM PIZZIGATI | BRIAN WAKAMO

Publication Date: Accessed 10 June 2022

Publication Site: Institute for Policy Studies

The CEO-to-Worker Pay Gap Is Climbing to Truly Obscene Levels

Link: https://jacobin.com/2022/06/ceo-worker-pay-gap-obscene-levels-lowest-median-wages

Excerpt:

new report from the Institute for Policy Studies (IPS) analyzes compensation at the three hundred publicly held US corporations with the lowest median wages in 2020. The report, authored by Sarah Anderson, Sam Pizzigati, and Brian Wakamo, finds that the average gap between CEO and median worker pay jumped to 670:1 in 2021, up from 604:1 in 2020. Forty-nine of the firms had ratios above 1,000:1.

Wages at 106 of the firms did not keep pace with the 4.7 percent average US inflation rate last year, and of those, sixty-seven spent resources buying back their own stock, with repurchases totaling $43.7 billion. The biggest buybacks took place at Lowe’s, Target, and Best Buy. As the IPS notes, “With the $13 billion Lowe’s spent on share purchases, the company could have given each of its 325,000 employees a $40,000 raise. Instead, median pay at the company fell 7.6 percent to $22,697.” None of the big-box stores’ retail workers are currently unionized, though there are nascent union campaigns underway at several Target stores.

Of the three hundred companies analyzed by the IPS, 40 percent received federal contracts between October 1, 2019 and May 1, 2022, for a combined value of $37.2 billion. Only six of the 119 contractors had pay gaps of less than 100:1. Maximus, a company that handles federal student debts and Medicare call centers, took in the most federal contracts of any of the firms, with $12.3 billion during the period under consideration. IPS notes that Maximus CEO Bruce Caswell made $7.9 million in compensation, or 208 times the firm’s median income and thirty-six times the salary of the officials who direct the agencies awarding the contracts.

Author(s): Alex N. Press

Publication Date: 7 June 2022

Publication Site: Jacobin

Wage Stagnation and Its Discontents: Rethinking the Safety Net to Encourage a More Dynamic Economy

Link: https://www.manhattan-institute.org/schrager-wage-stagnation-rethinking-safety-net

Graphic:

Excerpt:

Guaranteed jobs or UBI are poorly targeted and do not match the needs of new workers and may even hold them back by offering the sort of guarantees that perpetuate wage stagnation. Instead, the new safety net should offer various programs to smooth out dips in income and offer benefits that are not tied to a single employer, including:

Wage insurance—benefits that account for a drop in income, not just a loss of employment

Income averaging—tax rates based on income over three or five years, not just a single year, which will make income more stable for workers in variable work arrangements

Providing contingent workers the opportunity to receive benefits, such as health care and sick leave, that are not tied to traditional employment

To protect themselves against income risk, Americans have resorted to stagnation. We can provide downside protection in alternate ways—so that Americans can feel more free to switch jobs, try alternative forms of work, or start new companies. The above-mentioned programs are a more cost-effective and efficient way to address the needs of the new labor force than the guarantee-oriented policies that receive more attention. These programs provide options that would provide more robust insurance that can help spur a more dynamic economy. The options are merely a starting point to think more creatively about how to support a changing economy and break the cycle of stagnation.

Author(s): Allison Schrager

Publication Date: 9 September 2021

Publication Site: Manhattan Institute

What explains the decline in r∗? Rising income inequality versus demographic shifts

Link: https://www.kansascityfed.org/documents/8337/JH_paper_Sufi_3.pdf

Graphic:

Excerpt:

Downward pressure on the natural rate of interest (r∗) is often attributed to an increase in saving. This study uses microeconomic data from the SCF+ to explore the relative importance of demographic shifts versus rising income inequality on the evolution of saving behavior in the United States from 1950 to 2019. The evidence suggests that rising income inequality is the more important factor explaining the decline in r∗. Saving rates are significantly higher for high income households within a given birth cohort relative to middle and low income households in the same birth cohort, and there has been a large rise in income shares for high income households since the 1980s. The result has been a large rise in saving by high income earners since the 1980s, which is the exact same time period during which r∗ has fallen. Differences in saving rates across the working age distribution are smaller, and there has not been a consistent monotonic shift in income toward any given age group. Both findings challenge the view that demographic shifts due to the aging of the baby boom generation explain the decline in r∗.
.

Author(s): Atif Mian, Ludwig Straub, Amir Sufi

Publication Date: August 2021

Publication Site: Kansas City Federal Reserve

Stay in Your Lane

Link: https://www.city-journal.org/fed-is-not-the-right-institution-to-tackle-economic-inequality

Excerpt:

While the economic case for reducing inequality isn’t clear, a moral case can be made. One could argue that it’s wrong for the few to have so much while the many have so little. But it’s not the Fed’s job to make moral decisions about the ideal distributions of wealth. This is an inherently political calculation—one that should be addressed through institutions directly accountable to voters. Moreover, the tools at Congress’s disposal—tax rates and control over benefits, for example—are better suited for taking on inequality. And these policies involve costs, too, in terms of growth. Voters should be the ones to decide whether they want to pay them.

The Fed’s role is to balance short- and long-term interests, making the hard choices that may harm the economy now in exchange for long-term stability and expansion. Once politics are involved, however, it becomes difficult if not impossible to make this trade-off. The Fed can do what it does because it has a narrow mandate: reasonable inflation and maximum employment. It needs to stay in its lane.

Author(s): Allison Schrager

Publication Date: 2 September 2021

Publication Site: City Journal

Softer monetary policy increases inequality

Link: https://voxeu.org/article/softer-monetary-policy-increases-inequality

Graphic:

Excerpt:

Our first set of results concern the effects of monetary policy on disposable income. We show that softer monetary policy increases disposable income at all income levels, but that the gains are highly heterogeneous and monotonically increasing in the income level. As shown in Figure 1, a decrease in the policy rate of one percentage point raises disposable income by less than 0.5% at the bottom of the income distribution, by around 1.5% at the median income level, and by more than 5% for the top 1% over a two-year horizon.

Author(s): Asger Lau Andersen, Niels Johannesen, Mia Jørgensen, José-Luis Peydró

Publication Date: 19 April 2021

Publication Site: Vox EU

Pritzker Lobbies For Huge Federal Tax Cut For The Rich With Dishonest Letter To Biden – Wirepoints

Graphic:

Excerpt:

The SALT cap increased “taxes on hardworking families,” says the letter. That’s “untenable given the dire economic conditions caused by the pandemic.” It goes on to say, “In short, middle-class Americans are struggling under this federal tax burden, while corporations – which are still able to fully deduct SALT as business expenses – are profiting because of the same law. The negative impacts of the SALT cap on middle class families are particularly egregious when you consider that in the states most affected by this cap, the federal government already takes more in federal taxes than the states receive in federal support, effectively subsidizing federal payments to other states.”

Tax analysts on the right and the left have documented why that’s completely false. The cap on SALT deductions was a windfall for the middle class and hammered high income taxpayers. The conservative Tax Foundation explained why here, and the liberal Institute on Taxation and Economic Policy, ITEP, wrote this in an article opposing elimination of the cap:

ITEP estimated that this would cost more than $90 billion in a single year. We found that 62 percent of the benefits would go to the richest 1 percent and 86 percent would go to the richest 5 percent. There is no state where this is a primarily middle-class issue. In every state and the District of Columbia, more than half of the benefits would go to the richest 5 percent of taxpayers. In all but six states, more than half of the benefits would go to the richest 1 percent. 

Author(s): Mark Glennon

Publication Date: 5 April 2021

Publication Site: Wirepoints

Who Gets to Live to 100 and Who Doesn’t? Reviewing the 2020 Living to 100 Symposium Monograph

Link: https://www.soa.org/sections/reinsurance/reinsurance-newsletter/2021/march/rsn-2021-03-kaufhold/

Excerpt:

Given these advances in understanding the theoretical methods of evaluating multiple, related mortality data sets, it is particularly promising that the Human Mortality Database, with the SOA’s sponsorship, has recently made available mortality data for the United States at the level of the individual county. Moreover, Professor Magali Barbieri of University of California, Berkeley in January 2021 published an SOA Research Report[3] on “Mortality by Socio-economic Category in the United States” using this data series. Professor Barbieri is one of the directors of the HMD project, which is jointly run by UC Berkeley and the Max Planck Institute for Demographic Research in Rostock, Germany and support from the Center on the Economics and Development of Aging (CEDA) and the French Institute for Demographic Studies (INED). In her paper, Barbieri studies socio-economic differences linked to mortality differentials by county, based on information available at the county level regarding education, occupation, employment, income, and housing. The gap between the highest and lowest county decile is huge and growing. In 2018, the qx-rate for 45-year-old men in counties with the lowest Socioeconomic Index Score (SIS) was 2.5 times that for men of that age in counties with the highest SIS. This gap is even greater than the difference between smokers and non-smokers. Professor Barbieri’s report shows the widening trend between the different socio-economic strata which she captures by grouping the counties into deciles by SIS. While the highest SIS score is associated with a life expectancy that matches or even beats the OECD average, people living in counties with the lowest SIS have hardly seen any improvement in their life expectancy over the last four decades. Comparing the average life expectancy at birth within the highest decile of counties to the lowest, there was a gap of 3.0 years in 1982, the first year for which consistent data was available. This gap has more than doubled since then, rolling in at 6.6 years difference in life expectancy in 2018. That is an increase of 120 percent. Worse still, the gender gap once again manifests itself in the mortality trends, with females showing an increase of the socio-economic mortality gap of 260 percent over the 36-year period, compared to 76 percent for males.

Author(s): Kai Kaufhold

Publication Date: March 2021

Publication Site: Reinsurance News at the Society of Actuaries

Those Who Switched to Telework Have Higher Income, Education and Better Health

Link: https://www.census.gov/library/stories/2021/03/working-from-home-during-the-pandemic.html

Graphic:

Excerpt:

Those who substituted some or all of their typical in-person work for telework tended to have higher household incomes than those who did not switch to telework.

In the highest-earning households — those with annual incomes of $200,000 or more — 73.1% switched to telework (Figure 1). This is more than double the percentage (32.1%) of households with incomes between $50,000 and $74,999, a range that includes the 2019 median U.S. household income ($65,712). 

Lowest-earning households were less likely to switch to telework. Only 12.7% of households earning under $25,000 reported teleworking in lieu of in-person work.

Author(s): JOEY MARSHALL, CHARLYNN BURD, MICHAEL BURROWS

Publication Date: 31 March 2021

Publication Site: United States Census Bureau

Testimony: Senate Budget Committee Hearing on the Progressivity of the U.S. Tax Code

Graphic:

Excerpt:

In case you are thinking, “Well, the rich make more, they should pay more,” the top 1 percent of taxpayers account for 20 percent of all income (AGI). So, their 40 percent share of income taxes is twice their share of the nation’s income.  

Similarly, in 2018, the top 0.1 percent of taxpayers paid $311 billion in income taxes. That amounted to 20 percent of all income taxes paid, the highest level since 2001, as far back as the IRS data allows us to measure. The top 0.1 percent of taxpayers in 2018 paid a greater share of the income tax burden than the bottom 75 percent of taxpayers combined.

Author(s): Scott A. Hodge

Publication Date: 25 March 2021

Publication Site: Tax Foundation

Covid-19 Isn’t the Only Thing Shortening American Lives

Link: https://www.bloomberg.com/opinion/articles/2021-02-23/covid-19-isn-t-the-only-thing-shortening-american-lives

Graphic:

Excerpt:

The 2020 life expectancy numbers also underscore longer-term health challenges that were already alarming. For two to three decades, life expectancy has been improving much more rapidly for higher earners than for lower earners, and 2020 has probably made these gaps worse. The one bright spot in the differential trends before the pandemic had been a narrowing of racial differences. These new estimates show a dramatic reversal of that hopeful pattern. From the early 1990s to 2016, the racial gap in life expectancy for males at birth shrunk from more than 8 years to about 4.5. During the first half of 2020, it widened to more than 7 years.

…..

On the contrary, 2020 mortality data indicate that death rates from non-Covid causes rose, despite the economic recession. More Americans than expected died from diabetes, high blood pressure and pneumonia. Some of these deaths may have been misreported, and actually caused by Covid. But a large number may also reflect the challenges in providing non-Covid health care during the past year, as people have avoided hospitals, and government mandates have restricted discretionary medical procedures. The pandemic will provide hard lessons on which types of medical care truly improve health, and which ones can be safely skipped or delayed.

Author(s): Peter R. Orszag

Publication Date: 23 February 2021

Publication Site: Bloomberg