Nine States Began the Pandemic With Long-Term Deficits

Link: https://www.pewtrusts.org/en/research-and-analysis/articles/2022/12/16/nine-states-began-the-pandemic-with-long-term-deficits

Graphic:

Excerpt:

Twenty states recorded annual shortfalls in fiscal year 2020, when the coronavirus pandemic triggered a public health crisis, a two-month recession, and substantial volatility in states’ balance sheets. States can withstand periodic deficits, but long-running imbalances—such as those carried by nine states—can create an unsustainable fiscal situation by pushing off some past costs for operating government and providing services onto future taxpayers.

States are expected to balance their budgets every year. But that’s only part of the picture of how well revenue—composed predominantly of tax dollars and federal funds—matches spending across all state activities. A look beyond states’ budgets at their own financial reports provides a more comprehensive view of how public dollars are managed. In fiscal 2020, a historic plunge in tax revenue collections and a spike in spending demands were met with an initial influx of federal aid to combat the pandemic. The typical state’s total expenses and revenues grew faster than at any time since at least fiscal 2002, largely thanks to the unprecedented federal aid. But spending growth outpaced revenue growth in all but five states (Idaho, Maryland, Missouri, South Dakota, and Virginia). And 20 states recorded annual shortfalls—the most since 2010 and four times more than in fiscal 2019.

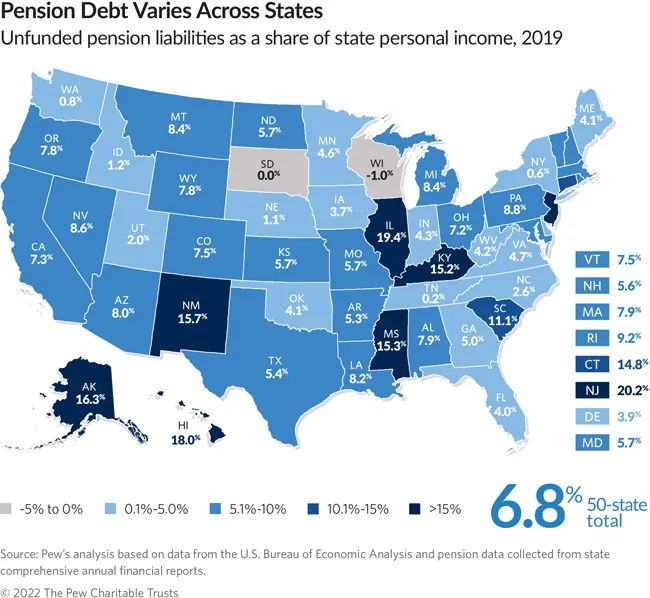
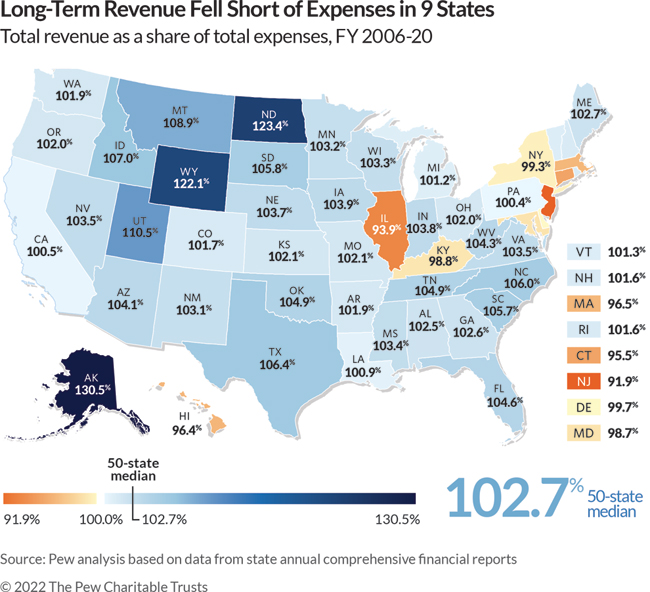
Despite the sudden increase in annual deficits, most states collected more than enough aggregate revenue to cover aggregate expenses over the long-term. But the nine states that had a 15-year deficit (New Jersey, Illinois, Connecticut, Hawaii, Massachusetts, Maryland, Kentucky, New York, and Delaware) —or a negative fiscal balance—carried forward deferred costs of past services, including debt and unfunded public employee retirement liabilities. Between 2006 and 2020, New Jersey accumulated the largest gap between its revenue and annual bills, taking in enough to cover just 91.9% of its expenses—the smallest percentage of any state. Meanwhile, Alaska collected 130.5%, yielding the largest surplus. The typical state’s revenue totaled 102.7% of its annual bills over the past 15 years.

Zooming out from a narrow focus on annual or biennial budgets—which may mask deficits as they allow for shifting the timing of when states receive cash or pay off bills to reach a balance—offers a big-picture look at whether state governments have lived within their means, or whether higher revenue or lower expenses may be necessary to bring a state into fiscal balance.

Author(s): Joanna Biernacka-Lievestro, Alexandre Fall

Publication Date: 16 Dec 2022

Publication Site: Pew

Report: Illinois overspending taxpayer money year after year

Link: https://www.thecentersquare.com/illinois/report-illinois-overspending-taxpayer-money-year-after-year/article_7bc5b8ba-8c84-11ed-a77d-a77c6a37c073.html?utm_source=thecentersquare.com&utm_campaign=%2Fnewsletters%2Flists%2Ft2%2Fillinois%2F&utm_medium=email&utm_content=headline

Excerpt:

An analysis by Pew Charitable Trusts shows that Illinois is one of only two states in the country with total tax revenue shortfalls exceeding 5% of total expenses, and the only ones with annual deficits in each of the past 15 years. The other state is New Jersey.

Pew state fiscal health manager Joanna Biernacka-Lievestro said Illinois is in select company.

“Nine states failed to collect enough revenue to cover their long-term expenses over the 15 years ending in fiscal 2020,” Biernacka-Lievestro said. “Secondly, Illinois was one of two states that struggled the most.” 

After New Jersey, Illinois had the largest deficit with aggregate revenue able to cover only 93.9% of aggregate expenses. In comparison, Indiana and Iowa were both close to 104%. Alaska collected 103.5%, yielding the largest surplus.

Author(s): Kevin Bessler

Publication Date: 4 Jan 2023

Publication Site: The Center Square

The State Pension Funding Gap: Plans Have Stabilized in Wake of Pandemic

Link: https://www.pewtrusts.org/en/research-and-analysis/issue-briefs/2021/09/the-state-pension-funding-gap-plans-have-stabilized-in-wake-of-pandemic

Graphic:

Excerpt:

Since the fiscal 2019 reporting period ended, an unprecedented $5 trillion in federal stimulus and other government interventions have buoyed financial markets and strengthened plan balance sheets.2 As a result, state plans earned returns of over 25% in fiscal 2021—a highwater mark not seen since the 1980s. Pew estimates that total unfunded liabilities dropped below $1 trillion by the end of fiscal 2021, which would push state plans to be more than 80% funded for the first time since 2008. (See Figure 1; for more detail, see also Appendix G.) The significant improvement in plans’ fiscal position is due in large part to dramatic increases in employer contributions to state pension funds in the past decade, which boosted assets by more than $200 billion. Since 2010, annual contributions to state pensions have increased by 8% annually, twice the rate of revenue growth. And for the 10 lowest-funded states, the yearly growth in employer contributions averaged 15% over this period. As a result, after decades of underfunding and market losses from risky investment strategies, for the first time this century states are expected to have collectively achieved positive amortization in 2020—meaning that payments into state pension funds were sufficient to pay for current benefits as well as reduce pension debt.

An increase in pension contributions of the size seen over the past decade signals a shift in budget priorities by state policymakers and a recognition that the costs of postponing obligations are untenable if left unaddressed. Although this has improved the outlook for state pension plans, it has also crowded out spending on other important programs and services and left states with less budgetary space to sustain future rises in pension payments.

Author(s): Greg Mennis, David Draine

Publication Date: 14 Sept 2022

Publication Site: Pew Trust

Report: CT’s pension debt remains high despite residents’ personal wealth

Link: https://ctmirror.org/2022/08/02/report-ct-pension-debt-personal-income-high-eighth-worst-us/

Graphic:

Excerpt:

When Connecticut deposits roughly $4.1 billion into its pension funds this fall, it will mark the third consecutive year the state used its budget surplus to whittle down the massive pension debt accrued over more than seven decades.

But a recent analysis from The Pew Charitable Trusts provided a sobering reminder of just how far Connecticut still has to go — even considering its great wealth — to overcome decades of fiscal irresponsibility.

Connecticut had reported more than $41 billion in combined debt among its pensions for state employees and for teachers following the 2019 fiscal year. According to Pew, that represented 14.8% of Connecticut’s personal income at the time — more than double the national average of 6.8%.

Connecticut was one of just 10 states that topped the 10% mark, and ranked eighth-worst overall. New Jersey finished at the bottom with pension debt equal to 20.2% of statewide personal income.

Author(s): Keith Phaneuf

Publication Date: 2 Aug 2022

Publication Site: CT Mirror

Stock Market Helps State Pension Debt Hit 10-Year Low, But Crisis Still Looms Large

Link: https://www.forbes.com/sites/lizfarmer/2021/09/23/stock-market-helps-state-pension-debt-hit-10-year-low-but-crisis-still-looms-large/

Graphic:

Excerpt:

After state pension debt grew to more than $1.4 trillion last year, two new reports estimate that gap between the total amount states have promised to retirees and what they’ve actually set aside in their pension investment funds will shrink dramatically. A recent analysis by the Pew Charitable Trusts says the gap could dip below $1 trillion this year. And a report released today by the Equable Institute estimates that 2021 returns will shrink state pension debt to $1.08 trillion.

The gains in the stock market played a big role. Equable’s report calculates that preliminary 2021 investment returns averaged an astounding 20.7% return. That’s nearly triple the average assumed rate of return in any given year. Those gains will boost the average pension plan to about 80% funded, the highest funding ratio since 2008.

Author(s): Liz Farmer

Publication Date: 23 Sept 2021

Publication Site: Forbes

California Pensions Improve Slightly, Still Deep in the Red

Link: https://www.theepochtimes.com/california-pensions-improve-slightly-still-deep-in-the-red_4003251.html

Excerpt:

The 80 percent mark long has been considered the minimum threshold for a pension fund. However, that’s actually still too low. An Issue Brief by the American Academy of Actuaries called it, “The 80% Pension Funding Standard Myth” (pdf).

It said, “An 80 percent funded ratio often has been cited in recent years as a basis for whether a pension plan is financially or ‘actuarially’ sound. Left unchallenged, this misinformation can gain undue credibility with the observer, who may accept and in turn rely on it as fact, thereby establishing a mythic standard. … Pension plans should have a strategy in place to attain or maintain a funded status of 100 percent or greater over a reasonable period of time.”

Author(s): John Seiler

Publication Date: 19 Sept 2021

Publication Site: The Epoch Times

Population Growth Sputters in Midwestern, Eastern States

Link: https://www.pewtrusts.org/en/research-and-analysis/articles/2021/07/27/population-growth-sputters-in-midwestern-eastern-states

Graphic:

Excerpt:

Apart from states with declines—West Virginia, Mississippi, and Illinois—the slowest population growth rates were recorded in Connecticut (0.09%); Michigan (0.19%); and Ohio, Wyoming, and Pennsylvania (0.23% each).

States experiencing their slowest decade of growth ever were Illinois, Connecticut, and six others: Missouri (0.27%), Wisconsin (0.36%), California (0.60%), Hawaii (0.68%), Arizona (1.13%), and Florida (1.37%).

After Utah, Idaho, and Texas, the next fastest-growing states over the past decade were North Dakota (1.48%), Nevada (1.40%), Colorado (1.39%), and Washington and Florida (both 1.37%).

Growth was faster in the 2010s than in the 2000s in only 12 states: Iowa, Louisiana, Massachusetts, Michigan, Nebraska, New Jersey, New York, North Dakota, Ohio, Rhode Island, South Dakota, and Washington.

Author(s): Barb Rosewicz, Melissa Maynard, Alexandre Fall

Publication Date: 27 July 2021

Publication Site: Pew

Early Warning Systems Can Help States Identify Signs of Fiscal Distress

Link: https://www.pewtrusts.org/en/research-and-analysis/articles/2021/03/04/early-warning-systems-can-help-states-identify-signs-of-fiscal-distress?utm_campaign=2021-03-09+Squeeze+map&utm_medium=email&utm_source=Pew

Excerpt:

In a white paper for The Pew Charitable Trusts, Eric Scorsone and Natalie Pruett of the Michigan State University Extension’s Michigan Center for Local Government Finance & Policy assessed local government early warning systems through case studies in Colorado, Louisiana, Ohio, and Pennsylvania. Each of these states applies various financial ratios—an approach known as ratio analysis—and other indicators to identify signs of local fiscal distress. Ratio analysis uses fractions that capture financial or economic activity within a locality—such as total expenditures over total revenues—to measure solvency, the ability to pay debts and liabilities over the short or long term. Ultimately, the authors determined that there isn’t one optimal system and instead offer several recommendations for states to build or improve their early warning systems.

The authors present detailed descriptions of the four states’ systems and analyze trade-offs and implications of the indicators employed to measure different types of solvency. They offer a variety of recommendations for states to consider, including use of indicators for four types of solvency:

Author(s): Jeff Chapman

Publication Date: 4 March 2021

Publication Site: Pew Trusts

As Federal Aid Stalled, State And Local Governments Issued Bonds To Pay Current Bills

Link: https://www.forbes.com/sites/lizfarmer/2021/01/30/as-congress-stalled-on-a-relief-package-governments-relied-on-borrowing-to-pay-the-bills/?

Excerpt:

Between August and mid-December of 2020, at least one-quarter of large bond issuances in the municipal market involved some form of deficit financing, according to an analysis by Municipal Market Analytics (MMA). The firm analyzed 442 municipal bond issuances that totaled at least $100 million.

MMA’s Matt Fabian and Lisa Washburn added that their tally was conservative and that as many as half of those 442 issuances may have involved deficit financing because the ultimate use of the money wasn’t always clear.

“These are not typical uses of the municipal bond market, where an overwhelming majority of financing is for long-term infrastructure projects,” they told the Pew Charitable Trusts. “But last year, with state and local governments seeking as much as possible to avoid cutting spending, raising taxes, or postponing pension payments, they shifted their emphasis to short-term and temporary solutions. As the pandemic continued and federal stimulus money dried up, they increasingly took on debt for budgetary help.”

Author(s): Liz Farmer

Publication Date: 30 January 2021

Publication Site: Forbes