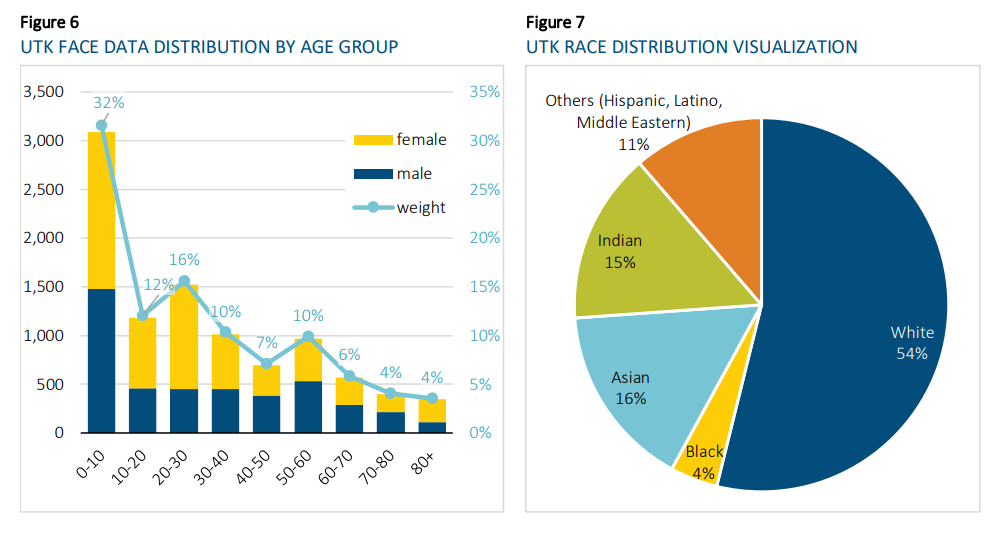
This paper is an introduction to AI technology designed for actuaries to understand how the technology works, the potential risks it could introduce, and how to mitigate risks. The author focuses on data bias as it is one of the main concerns of facial recognition technology. This research project was jointly sponsored by the Diversity Equity and Inclusion Research and the Actuarial Innovation and Technology Strategic Research Programs
The city has only ever recorded this large loss of human life twice in its history, matching the record of 500 deaths during the crack cocaine epidemic in 1990.
Since Tuesday, the total has risen to 502, a 7% reduction from 2021, per the city’s dashboard .
The total in 2022 only pales slightly in comparison to last year’s record-breaking total. In 2021, Philadelphia recorded 562 homicides, with 501 of the deaths due to gun violence alone, per Axios.
Homicide victims in Philadelphia for 2022 spanned across all ages, from as young as 9 to as old as 78. The 500th homicide was a man, 35, shot in the city’s Ogontz section on Sunday afternoon, and he died hours later from his injuries, police confirmed to multiple outlets.
The demographics surrounding the homicides reflect the extent to which gun violence plagues the city. Of the 500 homicides, 30 victims were juveniles, with seven being 14 years old or younger. According to police, 84% of people killed or injured in shootings this year were black.
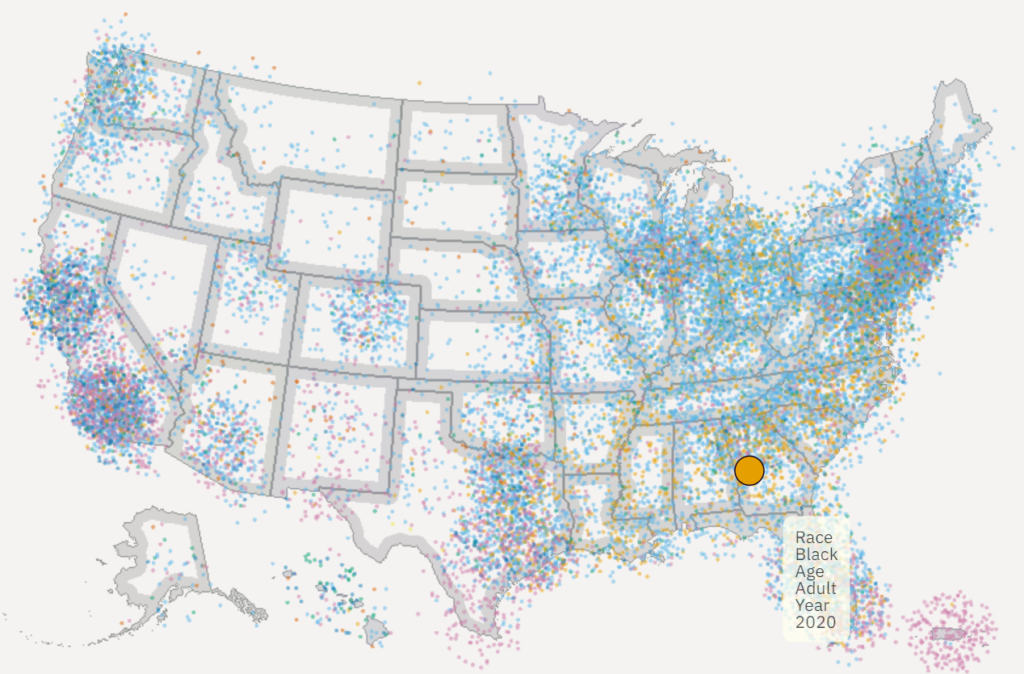
One point per person in the US for the 2010 and 2020 censuses, fully zoomable and interactive using WebGL and [Deepscatter](https://github.com/CreatingData/deepscatter). Since this uses WebGL individual point rendering and quadtiled data, it can be far more responsive than raster-based maps you may have seen in 2010. Plus, if you zoom all the way in in some views it has little person glyphs!
The Centers for Disease Control and Prevention has created the public concern about black maternal mortality. In February, the CDC released data showing that the maternal mortality rate for black women is 2.9 times higher than the rate for white women. It’s a worrisome statistic, yet the CDC’s own data, as well as a study from the CDC Foundation, provide crucial (and generally unreported) context.
To be clear, even a single death of a pregnant woman is one too many. But the overwhelming majority of women survive motherhood: in 2020, according to the CDC, 861 women in the United States died related to pregnancy, out of a total of about 3.6 million births—a rate of 0.02 percent. Just over 350 were white, while just under 300 were black. Scientifically speaking, it’s hard to draw society-wide conclusions from such a small sample. It’s even harder when you recognize that the CDC statistics include deaths that occurred up to a year after delivery, as well as those caused by underlying and preexisting medical conditions that pregnancy may have aggravated. And the CDC admits that the systems for identifying mortality rates are prone to error.
….
The panel found that less than about a third of the preventable deaths, across all races, were attributable to individual providers. It did not cite racial bias as the reason. Yet the academic and media narrative leads to the assumption that black mothers are dying because doctors and nurses are racist. This leads to a corresponding claim that black mothers would die less often if they saw black doctors, which some call “racial concordance.” These are strange assertions, since Hispanic maternal mortality is lower than the rate for whites, which wouldn’t be true if medical professionals were racist. Yet these claims are still being used to justify discriminatory and dangerous policies across health care.
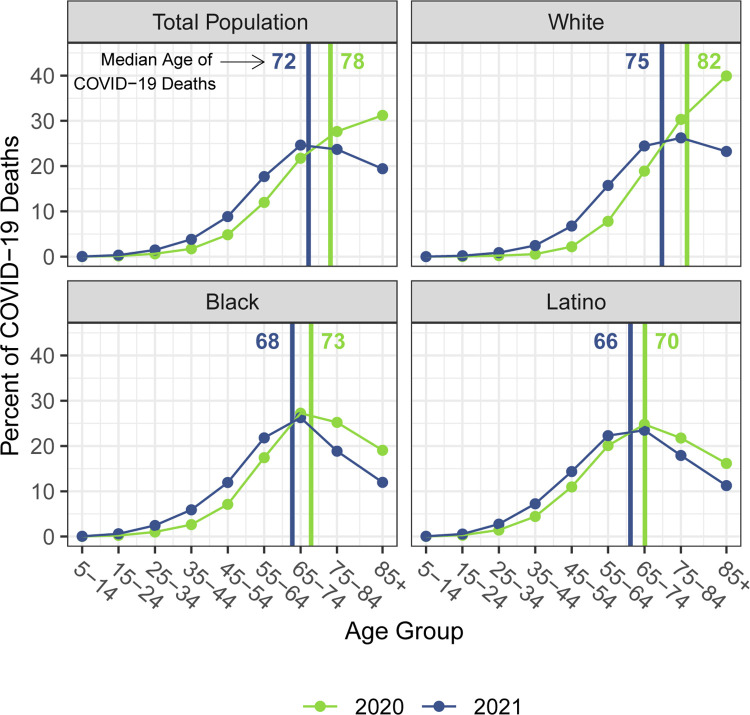
COVID-19 had a huge mortality impact in the US in 2020 and accounted for most of the overall reduction in 2020 life expectancy at birth. There were also extensive racial/ethnic disparities in the mortality impact of COVID-19 in 2020, with the Black and Latino populations experiencing reductions in life expectancy at birth over twice as large as that of the White population. Despite continued vulnerability of these populations, the hope was that widespread distribution of effective vaccines would mitigate the overall mortality impact and reduce racial/ethnic disparities in 2021. In this study, we quantify the mortality impact of the COVID-19 pandemic on 2021 US period life expectancy by race and ethnicity and compare these impacts to those estimated for 2020. Our estimates indicate that racial/ethnic disparities have persisted, and that the US population experienced a decline in life expectancy at birth in 2021 of 2.2 years from 2019, 0.6 years more than estimated for 2020. The corresponding reductions estimated for the Black and Latino populations are slightly below twice that for Whites, suggesting smaller disparities than those in 2020. However, all groups experienced additional reductions in life expectancy at birth relative to 2020, and this apparent narrowing of disparities is primarily the result of Whites experiencing proportionately greater increases in mortality in 2021 compared with the corresponding increases in mortality for the Black and Latino populations in 2021. Estimated declines in life expectancy at age 65 increased slightly for Whites between 2020 and 2021 but decreased for both the Black and Latino populations, resulting in the same overall reduction (0.8 years) estimated for 2020 and 2021.
Author(s): Theresa Andrasfay, Noreen Goldman
Publication Date: 31 Aug 2022
Publication Site: PLOS ONE
Citation: Andrasfay T, Goldman N. Reductions in US life expectancy during the COVID-19 pandemic by race and ethnicity: Is 2021 a repetition of 2020? PLoS One. 2022 Aug 31;17(8):e0272973. doi: 10.1371/journal.pone.0272973. PMID: 36044413; PMCID: PMC9432732.
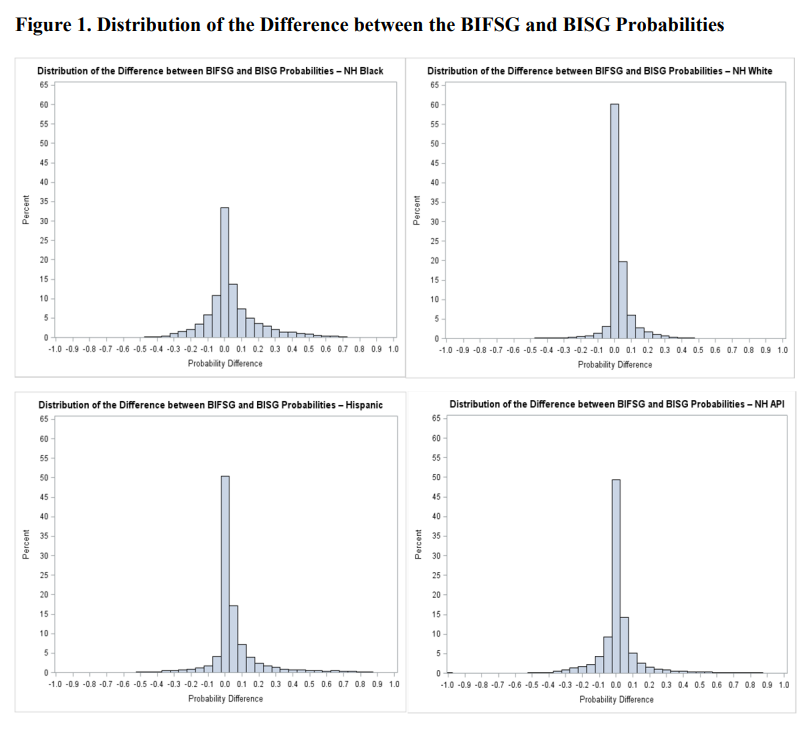
This paper uses a recent first name list to improve on a previous Bayesian classifier, the Bayesian Improved Surname Geocoding (BISG) method, which combines surname and geography information to impute missing race and ethnicity. The proposed approach is validated using a large mortgage lending dataset for whom race and ethnicity are reported. The new approach results in improvements in accuracy and in coverage over BISG for all major ethno-racial categories. The largest improvements occur for non-Hispanic Blacks, a group for which the BISG performance is weakest. Additionally, when estimating disparities in mortgage pricing and underwriting among ethno-racial groups with regression models, the disparity estimates based on either BIFSG or BISG proxies are remarkably close to those based on actual race and ethnicity. Following evaluation, I demonstrate the application of BIFSG to the imputation of missing race and ethnicity in the Home Mortgage Disclosure Act (HMDA) data, and in the process, offer novel evidence that race and ethnicity are somewhat correlated with the incidence of missing race/ethnicity information.
Author(s):
Ioan Voicu Office of the Comptroller of the Currency (OCC)
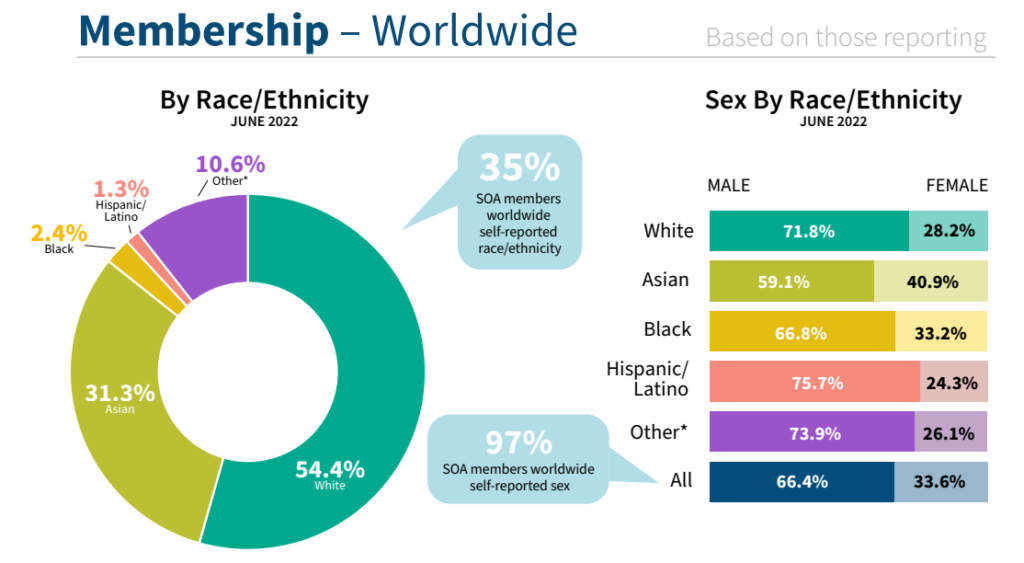
The Society of Actuaries (SOA) leadership and staff work closely with the Diversity, Equity, and Inclusion Committee (DEIC) to support the journey to increase diversity in membership and in the actuarial profession, as part of the SOA’s Long-Term Growth Strategy.
We strive for transparency and accountability in our DEI efforts and are committed to sharing our demographic data and long-term goals to support our pledge and responsibility. We have collected member voluntary demographic data since 2015. With this data, we present an infographic for the pathway from aspiring actuaries to members with ASA or FSA designations.
Narrow or prejudiced thinking is simple to write down and easy to copy and paste over and over. Descriptions such as “difficult” and “disruptive” can become hard to escape. Once so labeled, patients can experience “downstream effects,” said Dr. Hardeep Singh, an expert in misdiagnosis who works at the Michael E. DeBakey Veterans Affairs Medical Center in Houston. He estimates misdiagnosis affects 12 million patients a year.
Conveying bias can be as simple as a pair of quotation marks. One team of researchers found that Black patients, in particular, were quoted in their records more frequently than other patients when physicians were characterizing their symptoms or health issues. The quotation mark patterns detected by researchers could be a sign of disrespect, used to communicate irony or sarcasm to future clinical readers. Among the types of phrases the researchers spotlighted were colloquial language or statements made in Black or ethnic slang.
“Black patients may be subject to systematic bias in physicians’ perceptions of their credibility,” the authors of the paper wrote.
That’s just one study in an incoming tide focused on the variations in the language that clinicians use to describe patients of different races and genders. In many ways, the research is just catching up to what patients and doctors knew already, that discrimination can be conveyed and furthered by partial accounts.
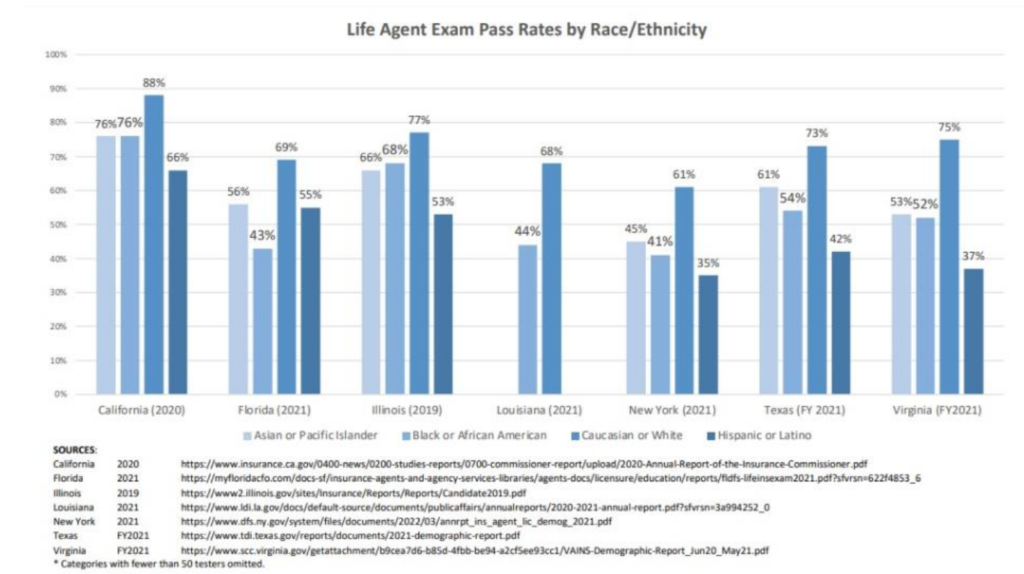
There have been recent efforts by the NAIC to report on the steps exam vendors have taken to mitigate cultural bias in producer licensing exams; however, based on state-level data, this issue deserves closer attention.
There are only seven states that annually prepare and publish licensing exam pass rates by demographic, including race/ethnicity. For more than a decade, these reports have routinely shown Caucasian/white candidates scoring higher than other demographic groups across nearly all lines.
When comparing Life Insurance Exam Pass Rates by Race/Ethnicity, an alarming trend appears. It’s clear that non-Caucasians or non-white demographics are not efficiently making it through the licensing process. This clearly suggests licensing exams warrant more scrutiny, particularly to ensure these tests are not screening diversity from the industry.
Systemic Influences and Socioeconomics ❑ Checking for and removing of systemic biases is difficult. ❑ Systemic biases can creep in at every step of the modeling process: data, algorithms, and validation of results. ❑ Human involvement in designing and coding algorithms, where there is a lack of diversity among coders ❑ Biases embedded in training datasets ❑ Use of variables that proxy for membership in a protected class ❑ Statistical discrimination profiling shopping behavior, such as price optimization ❑ Technology-facilitated advertising algorithms used in ad targeting and ad delivery
Author(s): David Sandberg, Data Science and Analytics Committee, AAA
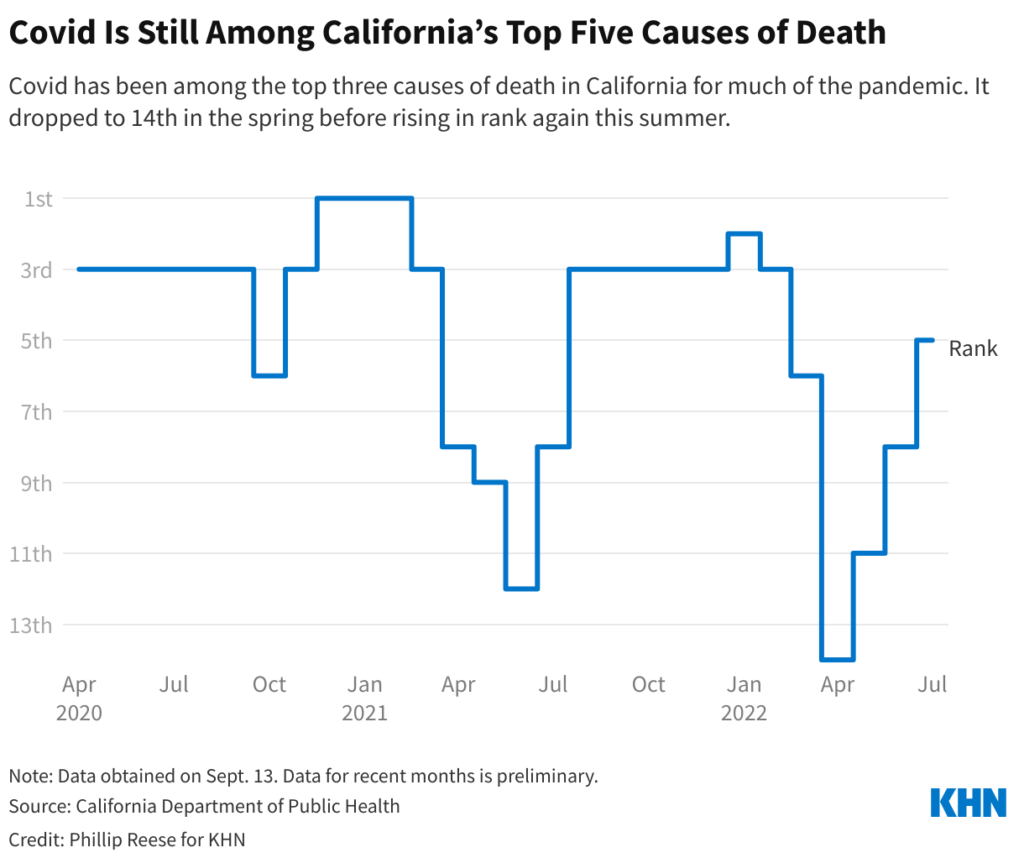
Californians age 75 and older made up 53% of covid deaths through July in 2022, up from 46% in 2020 and 2021. Only about 6% of the state’s residents are 75 and older. And white Californians 75 and older outnumber Latinos in that age group about 3 to 1.
In the initial vaccination rollout, California prioritized seniors, first responders, and other essential workers, and for several months in 2021 older residents were much more likely to be vaccinated than younger Californians.
“Now, the vaccination rates have caught up pretty much with everybody except for kids, people under 18,” Brewer said. “You’re seeing it go back to what we saw before, which is that age remains the most important risk factor for death.”
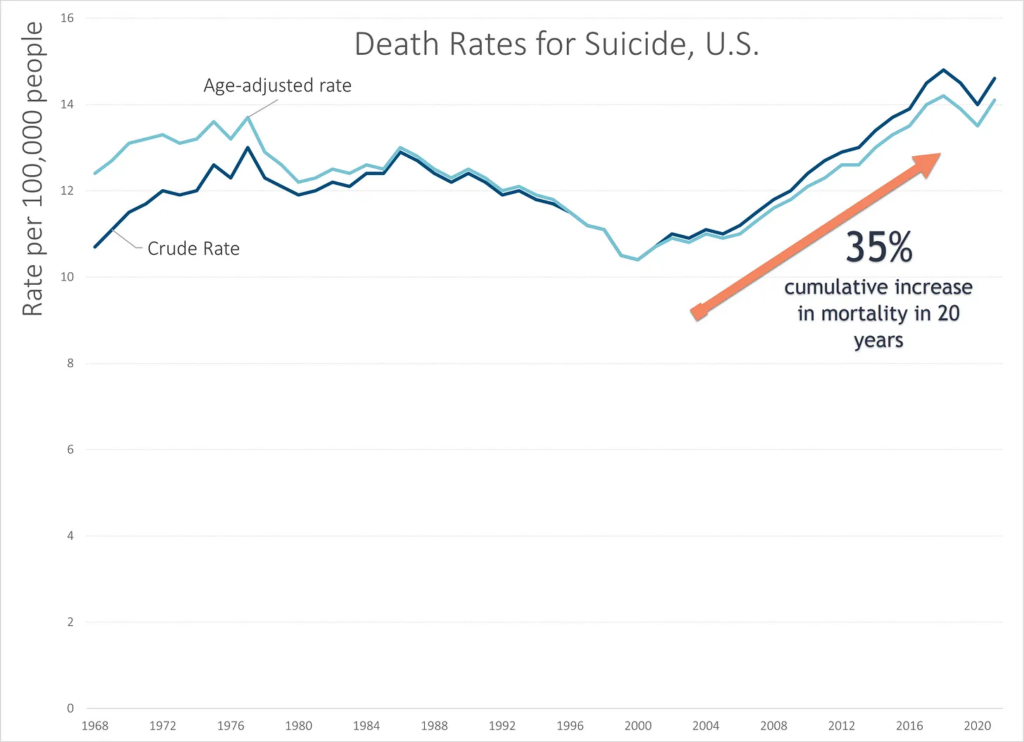
In updating the 2021 numbers, there is some bad news: while suicide rates had decreased in 2020, in 2021 they increased to continue a worrying trend:
The increase in 2021 brought the age-adjusted death rate back to a level close to the peak, which was in 2018.
As noted on the graph, the cumulative increase in the age-adjusted death rate from the minimum in 2000 to the current levels has been 35%. This is very worrying.
I could have exaggerated this trend by starting my vertical scale at 10 instead of 0, but I think it’s obvious enough the trend is bad.