Speed Limit Signs – a History of Speeding in the US

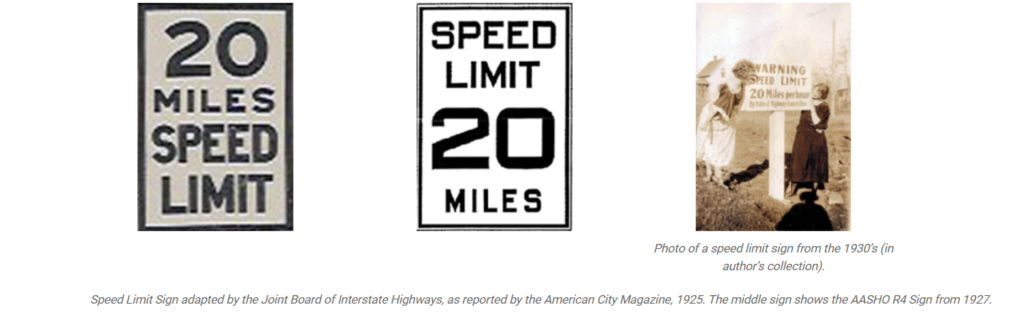
Link: https://www.roadtrafficsigns.com/speed-limit-signs-history

Graphic:

Excerpt:

The debate between those demanding the freedom to travel at high speeds in an unregulated environment and others citing the need for greater security and increased regulation (e.g. signs) was common in the 20’s and 30’s. For certain communities, “too slow speeds” were also an issue. As reported in the June, 1925 Lyle Sign Post, the chairman of the Maryland State Roads Commission, John Mackall, “advises substitution of the maximum speed limit with a minimum speed limit, to speed up traffic. Mackall also suggested slow-moving vehicles be barred from main streets during peak hours”.

Many states did not require drivers licenses. As part of the author’s own family lore, there is a wonderful story of two strong-willed daughters, Lydia and Mary, traveling from their home in North Dakota to visit their father, Senator Langer, in Washington, DC. With little experience, other than on farm machinery and certainly no license, they ended up in Washington in record time. Speed limits (and the few Speed Limit Signs) were proudly ignored.

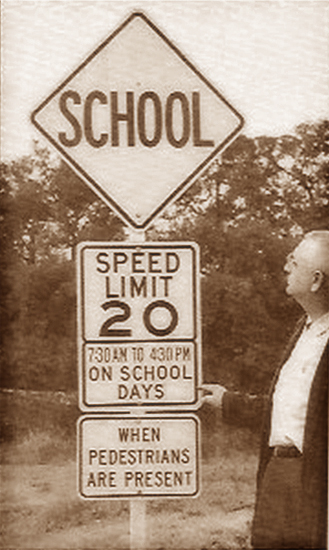
For more discussion, see the excerpt below on fixed speed limits: “Should there be Fixed Speed Limits?“. Even in the 30’s and 40’s, speed limits were not uniform. Should speed limits change, depending upon the weather conditions, road conditions and time of day (for example, during school hours)?

Publication Date: accessed 7 Jun 2023

Publication Site: RoadTrafficSigns.com

Traffic Safety Impact of the COVID-19 Pandemic: Fatal Crashes Relative to Pre-Pandemic Trends, United States, May–December 2020

Link: https://aaafoundation.org/traffic-safety-impact-of-the-covid-19-pandemic-fatal-crashes-relative-to-pre-pandemic-trends-united-states-may-december-2020/

PDF: https://aaafoundation.org/wp-content/uploads/2022/12/22-1339-AAAFTS_Impact-of-COVID-19_Research-Brief_r3.pdf

Graphic:

Excerpt:

A total of 38,824 people died in motor vehicle crashes in the U.S. in 2020, 2,570 (7.1%) more than forecast from models developed using data from 2011 through 2019 (Figure). In April 2020—the first full month of the pandemic—the number of fatalities was much lower than what would have been expected based on pre-pandemic trends. By May 2020, however, the actual number of fatalities was similar to historical levels. The number of fatalities greatly exceeded forecasts based on pre-pandemic trends for the remainder of 2020. In May through December collectively, there were a total of 28,611 traffic fatalities nationwide, which was 3,083 (12.1%) more than expected based on pre-pandemic trends.

The increase in traffic fatalities was not uniform across crash-, vehicle-, and driver-related factors. Scenarios present in greater than expected numbers in fatal crashes in 2020 included evening and late-night hours, speeding drivers, drivers with illegal alcohol levels, drivers without valid licenses, drivers of older vehicles, drivers of vehicles registered to other people, crash involvement and deaths of teens and young adults, and deaths of vehicle occupants not wearing seatbelts. In contrast, several crash types followed pre-pandemic trends (e.g., crashes in the middle of the day; crash involvements of drivers with valid licenses; pedestrian fatalities), and a few decreased (e.g., crashes of elderly drivers; crashes during typical morning commute hours).

Author(s): Brian C. Tefft, Meng Wang

Publication Date: December 2022

Publication Site: AAA Foundation

Crash Curse: In New York City, traffic deaths are up as enforcement is down.

Link: https://www.city-journal.org/nyc-traffic-deaths-up-as-enforcement-is-down

Graphic:

Excerpt:

Since the Covid pandemic hit New York City in March 2020, traffic deaths have skyrocketed, just as they have across the country. Locally and nationally, these deaths have paralleled the same double-digit trajectory upward as homicides and drug-overdose deaths. In 2019, 220 New Yorkers died on city streets, near the record low of 206, set the year before. In 2021, 273 people died, a nearly one-quarter increase in two years. In 2022, as of late May, 93 people have died, down slightly from last year, but 12 percent above pre-Covid levels.

….

s in many areas of public safety and public health, New York City started the pandemic with an advantage. In 2019, the city’s 220 traffic deaths—whether people in cars, or pedestrians, or cyclists—represented a per-capita rate of about 2.6 per 100,000 residents, just a small fraction of the 11.1 per 100,000 killed nationwide. Among large, urbanized areas, New York stood out for safety, as well. In Miami-Dade County in 2019, for example, the rate was 11 per 100,000; metro Atlanta’s rate was similar. Even among denser northeastern and mid-Atlantic cities, which have long had lower traffic-death rates than the sprawling south and west, New York performed slightly better than Boston, with its 2.8 traffic deaths per 100,000, and much better than Philadelphia, with its 5.7 deaths per 100,000.

Pre-pandemic, New York’s falling traffic deaths made it a national outlier. Between 2011, when traffic deaths hit a modern low nationwide, and 2019, such fatalities across the country rose by 11.9 percent, to 36,355 annually. In Gotham over this period, by contrast, they fell 12 percent. The difference in pedestrian casualties was especially striking. Nationwide, pedestrian deaths began rising in 2010, after having fallen, reasonably steadily, for at least three decades. By 2019, annual pedestrian deaths had risen from their 2009 low by more than half. But in New York, pedestrian deaths fell by 21.5 percent over the same near-decade.

Author(s): Nicole Gelinas

Publication Date: Summer 2022

Publication Site: City Journal

A NHTSA official spent years trying to cut road deaths. They jumped last year.

Link: https://www.washingtonpost.com/transportation/2022/05/21/road-deaths-fatalities-safety/

Graphic:

Excerpt:

Before Jeffrey Michael spent three decades in the federal government trying toreduce the nation’s road fatalities, he worked in college as a car mechanic.

He took that love of cars to the National Highway Traffic Safety Administration, where he worked on seat belts, child restraints, drunken driving and emergency medical services, eventually overseeing behavioral research at the agency. At home in the Washington suburbs, he would tinker with the 1987 Porsche 911 he bought as a fixer-upper. After retiring in 2018, he joined the Johns Hopkins Center for Injury Research and Policy.

Michael saw the abilityof federal programs to influence safety and cites a gradual reduction in road deaths over 50 years. But in an interview with The Washington Post — daysafter new NHTSA figures showed fatalities hitting a 16-year high — Michael pointed to the nation’s failure and potential fixes.

Author(s): Michael Laris

Publication Date: 21 May 2022

Publication Site: Washington Post

Study: Fewer crashes after Utah sets strictest DUI law in US

Link: https://www.ny1.com/nyc/all-boroughs/ap-online/2022/02/11/study-fewer-crashes-after-utah-set-strictest-dui-law-in-us

Graphic:

Excerpt:

Traffic deaths decreased in Utah after the state enacted the strictest drunken driving laws in the nation five years ago, new research published Friday by a U.S. government agency shows.

The findings, which pertain to fatalities involving and not involving alcohol, provide initial validation for conservative lawmakers who passed the law over concerns from restaurant and tourism industry lobbyists.

In the study published by the National Highway Traffic Safety Administration, researchers wrote that, in the years after Utah changed the drunken driving threshold from .08% to .05% blood-alcohol content, the number of crashes and fatalities fell even though drivers logged more miles.

“Changing the law to .05% in Utah saved lives and motivated more drivers to take steps to avoid driving impaired,” said Dr. Steven Cliff, the agency’s deputy administrator.

The findings mark a triumph for Utah’s Republican-controlled Legislature, which voted to decrease the legal limit in 2017 over concerns that it would discourage prospective new residents and tourists.

They and other opponents argued it would be ineffective and cement Utah’s pious reputation at the expense of the growing number of visitors and residents who aren’t part of the Church of Jesus Christ of Latter-day Saints.

Utah, where about 60% of the population are members of the faith, has long enforced some of the nation’s strictest liquor laws.

Author(s): Associated Press

Publication Date: 11 Feb 2022

Publication Site: NY1

Vehicle Crashes, Surging

Link: https://www.nytimes.com/2022/02/15/briefing/vehicle-crashes-deaths-pandemic.html

Graphic:

Excerpt:

Per capita vehicle deaths rose 17.5 percent from the summer of 2019 to last summer, according to a Times analysis of federal data. It is the largest two-year increase since just after World War II.

….

Rising drug abuse during the pandemic seems to play an important role, as well. The U.S. Department of Transportation has reported that “the proportion of drivers testing positive for opioids nearly doubled after mid-March 2020, compared to the previous 6 months, while marijuana prevalence increased by about 50 percent.” (Mid-March 2020 is when major Covid mitigations began.)

….

Vehicle crashes might seem like an equal-opportunity public health problem, spanning racial and economic groups. Americans use the same highways, after all, and everybody is vulnerable to serious accidents. But they are not equally vulnerable.

Traffic fatalities are much more common in low-income neighborhoods and among Native and Black Americans, government data shows. Fatalities are less common among Asian Americans. (The evidence about Latinos is mixed.) There are multiple reasons, including socioeconomic differences in vehicle quality, road conditions, substance abuse and availability of crosswalks.

Author(s): David Leonhardt

Publication Date: 15 Feb 2022

Publication Site: NYT

US road deaths rise at record pace as risky driving persists

Link: https://apnews.com/article/coronavirus-pandemic-business-health-transportation-pete-buttigieg-a16719e38d72f68e338030103e924cf0

Excerpt:

The number of U.S. traffic deaths surged in the first nine months of 2021 to 31,720, the government reported Tuesday, keeping up a record pace of increased dangerous driving during the coronavirus pandemic.

The estimated figure of people dying in motor vehicle crashes from January to September 2021 was 12% higher than the same period in 2020. That represents the highest percentage increase over a nine-month period since the Transportation Department began recording fatal crash data in 1975.

The tally of 31,720 deaths was the highest nine-month figure since 2006.

Federal data from the department’s National Highway Traffic Safety Administration showed that traffic fatalities increased during the nine-month period in 38 states, led by those in the West and South such as Idaho, Nevada and Texas, and was flat in two states. The numbers declined in 10 states and the District of Columbia.

Author(s): Hope Yen

Publication Date: 1 Feb 2022

Publication Site: Associated Press

Citations for Driving 100 Mph-Plus Climbing in Nevada

Link:https://www.insurancejournal.com/news/west/2022/02/07/652352.htm

Excerpt:

The number of drivers ticketed in Nevada for putting the pedal to the metal in violation of speed limits continues to climb.

Nevada Office of Traffic Safety data indicates over 5,100 citations were issued in 2021 to drivers going over 100 mph, up from over 3,500 in 2019 and over 4,400 in 2020, local news outlets reported.

“I would say there are definitely hundreds, if not thousands, of more citations of this type (that) would be given out if we are fully staffed,” said trooper Matthew Kaplan, president of the Nevada Police Union. “The ability to be out there enforcing is severely handicapped right now.”

Author(s): Associated Press

Publication Date: 7 Feb 2022

Publication Site: Insurance Journal

Preliminary Semiannual Estimates

Link:https://injuryfacts.nsc.org/motor-vehicle/overview/preliminary-estimates/

Graphic:

Excerpt:

Deaths up 16% as mileage starts to rebound in first six months of 2021

The National Safety Council (NSC) estimate of total motor-vehicle deaths for the first six months of 2021 is 21,450, up 16% from 18,480 in 2020 and up 17% from 18,384 in 2019. Mileage in the first six months of 2021 rebounded 13% from COVID lows in 2020 but still lags 2019 mileage by nearly 6%. The estimated mileage death rate in 2021 is 1.43 deaths per 100 million vehicle miles traveled, up 3% from 1.39 in 2020 and up 24% from 1.15 in 2019.

medically consulted injury is an injury serious enough that a medical professional was consulted. Based on the current medically consulted injury-to-death ratio of 114:1, and rounded to the nearest thousand, the estimated number of nonfatal medically consulted injuries resulting from crashes during in the first six months of 2021 was 2,445,000.

The estimated cost of motor-vehicle deaths, injuries, and property damage in the first half of 2021 was $241.9 billion.

Publication Date: accessed 8 Feb 2022

Publication Site: National Safety Council

Soaring US road deaths reflect the same lawlessness as murder surge does

Link:https://nypost.com/2022/02/06/soaring-road-deaths-reflect-lawlessness-in-the-us/

Excerpt:

Yet even as roads have grown more crowded, this trend has continued: 2020’s total 38,680 traffic deaths were 7.2% above 2019’s.

For the first nine months of 2021, road mileage driven wasn’t even 2% below 2019 levels. The 2020 reason for higher traffic deaths disappeared. People could no longer drive at 100 miles per hour because there was no one else around.

Yet traffic deaths were nearly 18% higher than two years before. The 12% increase between the first nine months of 2020 and 2021 was the highest hike in that period in recorded history, say federal regulators

When 2021’s full numbers are in, they’ll likely exceed 42,400 traffic deaths — the worst total in 16 years. Traffic deaths are supposed to fall every year, as road design and cars grow safer (although bigger cars are bad for pedestrians).

…..

This isn’t a universal phenomenon: Road deaths are down in France and Britain from 2019.

Author(s): Nicole Gelinas

Publication Date: 6 Feb 2022

Publication Site: NY Post

NHTSA Data Estimates Indicate Traffic Fatalities Continued to Rise at Record Pace in First Nine Months of 2021

Link:https://www.nhtsa.gov/press-releases/traffic-fatalities-estimates-jan-sept-2021

PDF: https://crashstats.nhtsa.dot.gov/Api/Public/ViewPublication/813240

Graphic:

Excerpt:

The U.S. Department of Transportation’s National Highway Traffic Safety Administration released its early estimate of traffic fatalities for the first nine months of 2021.

NHTSA projects that an estimated 31,720 people died in motor vehicle traffic crashes from January through September 2021, an increase of approximately 12% from the 28,325 fatalities projected for the first nine months of 2020. The projection is the highest number of fatalities during the first nine months of any year since 2006 and the highest percentage increase during the first nine months in the Fatality Analysis Reporting System’s history.

The new estimates come days after the U.S. Department of Transportation released the federal government’s first-ever National Roadway Safety Strategy, a roadmap to address the national crisis in roadway fatalities and serious injuries.

Publication Date: 1 Feb 2022

Publication Site: NHTSA

Death rates for young American adults rise due to overdoses, traffic accidents

Link: https://thepostmillennial.com/death-rates-for-young-american-adults-rise-due-to-overdoses-traffic-accidents

Excerpt:

Those aged 15-to-44 have seen fluctuating mortality rates since the 1950s, deviating from all other age groups that have seen steady decreases over the years. The age group’s mortality rate for the COVID-19 pandemic “pales in comparison” to the 1918 pandemic, according to Bloomberg.

“In March, a National Academies of Sciences, Engineering, and Medicine committee summed up their findings in a report titled ‘High and Rising Mortality Rates Among Working-Age Adults.’ Advances in overall life expectancy stalled in the US after 2010 even while continuing in other wealthy countries, the committee summed up, attributing this mainly to (1) rising mortality due to external causes such as drugs, alcohol and suicide among those aged 25 through 64 and (2) a slowing in declines in deaths from internal causes, chiefly cardiovascular diseases,” wrote Bloomberg.

Author(s): Hannah Nightingale

Publication Date: 18 June 2021

Publication Site: The Post Millennial