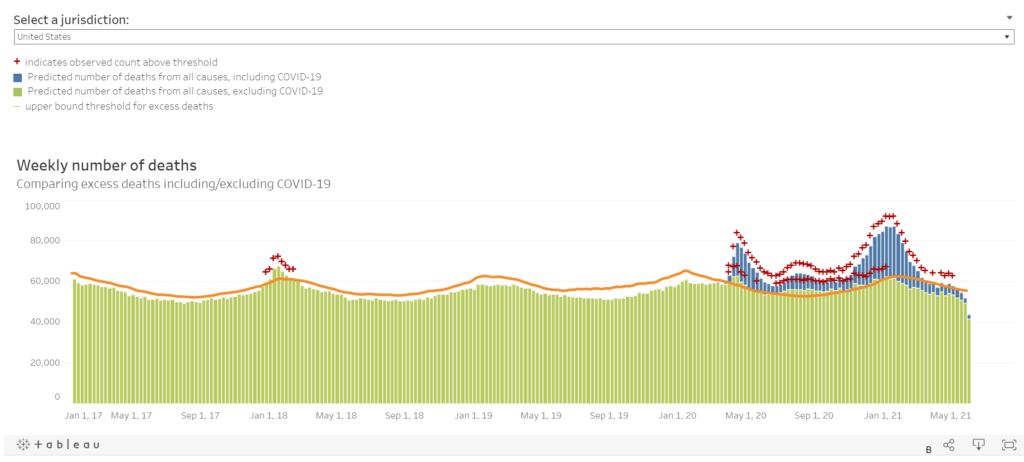
I want you to notice something — the blue bars are the “with COVID” portion of deaths, and the chartreuse bars are the ones “without COVID”. The bars are weekly counts of deaths when they occurred. Ignore the most recent weeks because they don’t have full data reported yet.
The red pluses indicate excess mortality, defined as exceeding the 95th percentile for expected mortality for that week (so it includes seaonality). You can see the excess mortality from the 2017-2018 flu season, which was bad for a flu season.
The non-COVID mortality has been in excessive mortality range for almost all 2020 after March. But since the beginning of 2021, it has dropped off…. and COVID mortality has also dropped off.
I think we may be almost in “normal” range soon. We shall see!
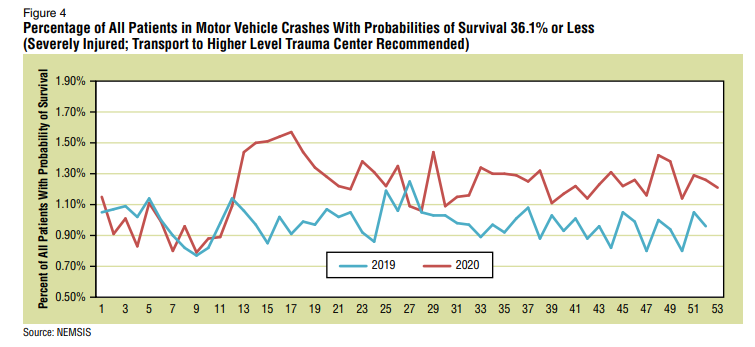
The NEMSIS data include metrics on crash severity. For people treated at the scenes of motor vehicle crashes, EMS professionals use an injury scoring system called the Revised Trauma Score (RTS) to determine the level of care needed to save the lives of the injured. Under RTS, patients who present with a probability of survival of 36.1% or less are considered severely injured and are often transported to Level 1 or Level 2 trauma centers that provide higher levels of critical care to the most severely injured. Figure 4 shows the percentage of patients in crashes whose probability of survival was in this range for 2019 and 2020. Beginning in Week 12 of 2020, the percentage of those injured with a probability of survival of 36.1% or less never dropped below 1%, suggesting an increase in the severity of crashes.
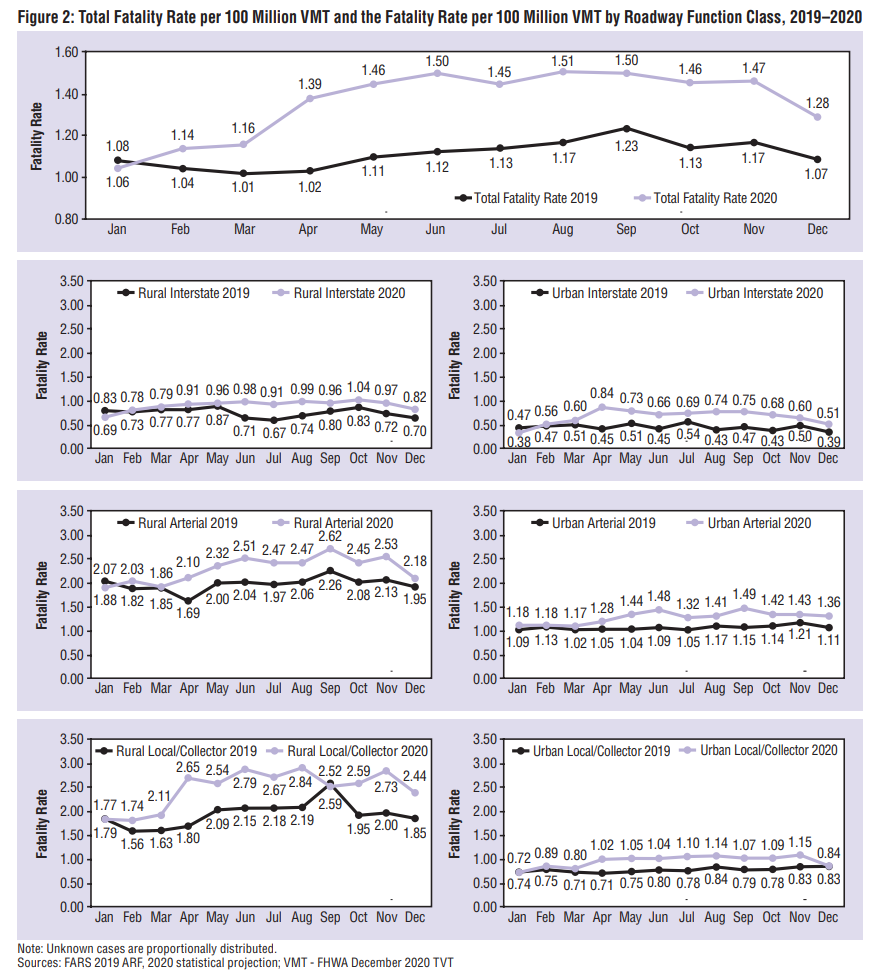
Total fatality rate per 100 million VMT [vehicle miles traveled] is broken down by roadway function class: rural versus urban interstate, arterial, local/collector/street. The results shown in Figure 2 indicate that the increased trend of the total fatality rate per 100 million VMT from March to December 2020, was mainly driven by the fatality rate per 100 million VMT on the rural local/collector/street, rural and urban arterial roadways.
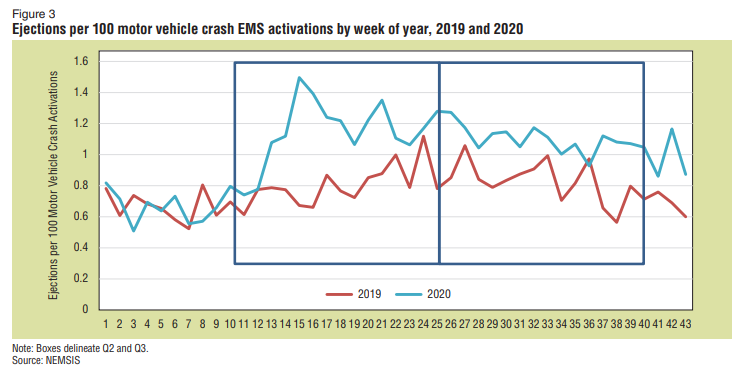
To a large extent, the risky traffic safety behaviors observed in Q2 continued in Q3. Frequency of triptaking continued to be lower, and a greater percentage of people stayed home in Q3 2020 compared to Q\3 2019. Ejection rates remained elevated compared to the same period a year earlier. New data on seat belt use among seriously injured drivers and passengers suggests that the belt use rate among those in serious crashes decreased in the early phases of the public health emergency at the study sites, but that rate may now be rebounding. The data also suggested that alcohol- and other drug-positive drivers and passengers who were seriously or fatally injured were much less likely to wear a seat belt than their counterparts who tested negative for all the drugs included in the study.
Speed data from the NPMRDS shows higher speeds in urban roadways across roadway types in Q3 2020 compared to the same period in 2019. Further, the greater speed dispersion in rural areas observed in Q2 continued in Q3 2020 compared to the same period in 2019.
Regarding alcohol and other drug prevalence among seriously and fatally injured drivers at the five trauma center study sites, more than 29% in the most recent period (July 19 to September 30) had measurable alcohol in their systems, with over 26% testing positive for the presence of cannabinoids and over 13% positive for opioids. In the same period, the percentage of drivers testing positive for at least one category of drugs remained above 60%, with nearly 25% testing positive for multiple categories of drugs. These observed increases in alcohol and other drug prevalence relative to before the public health emergency are consistent with the reported data that showed increases in marijuana and alcohol sales and consumption during the public health emergency. Overall, these data sets continue to have great potential to improve our understanding of the prevalence of drugs and alcohol among different types of seriously and fatally injured road users, as well as how prevalence may be changing over time during the public health emergency.
NHTSA just released some specs. When you look at the second quarter of 2020, the first full quarter of the pandemic, total traffic deaths have decreased by three percent compared to the second quarter of 2019. That translates into 302 fewer fatalities than the same period last year. I’m not discounting that drop, since Each man’s death diminishes me, For I am involved in mankind. However, the traffic volume didn’t drop just three percent, it dropped more than 16 percent. There should have been a lot fewer deaths than there were. The difference is idiots like the one I encountered.
NHTSA said that because traffic volumes decreased more significantly than the number of fatal crashes, the traffic fatality rate per 100 million vehicle miles travelled is projected to increase to 1.25 in the first half of 2020, up from 1.06 in the same period in 2019.