Link:https://www.drvinayprasad.com/p/observational-studies-of-covid-vaccine
Graphic:
Excerpt:
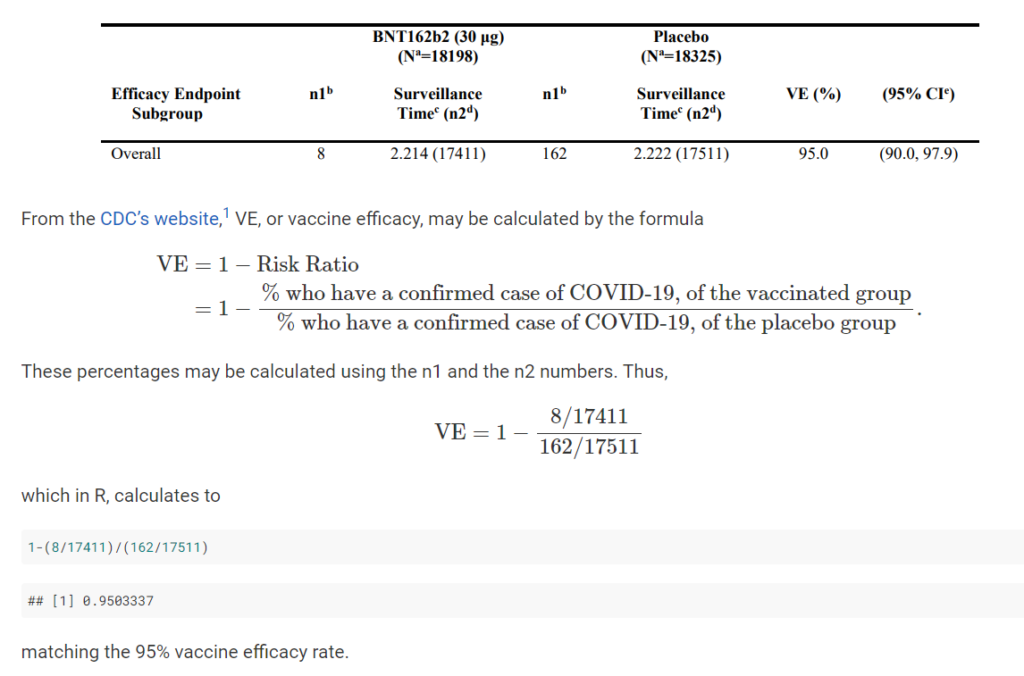
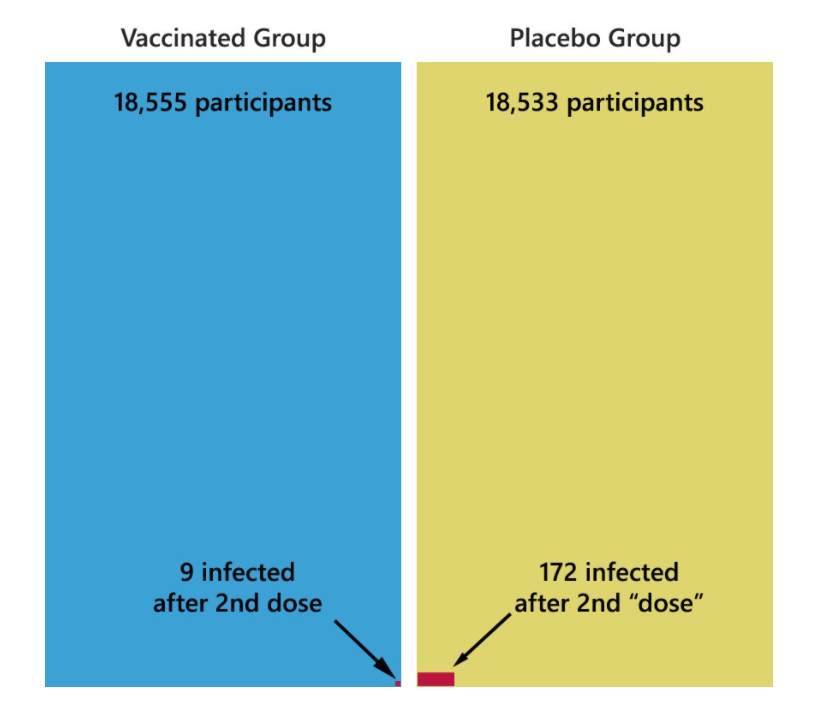
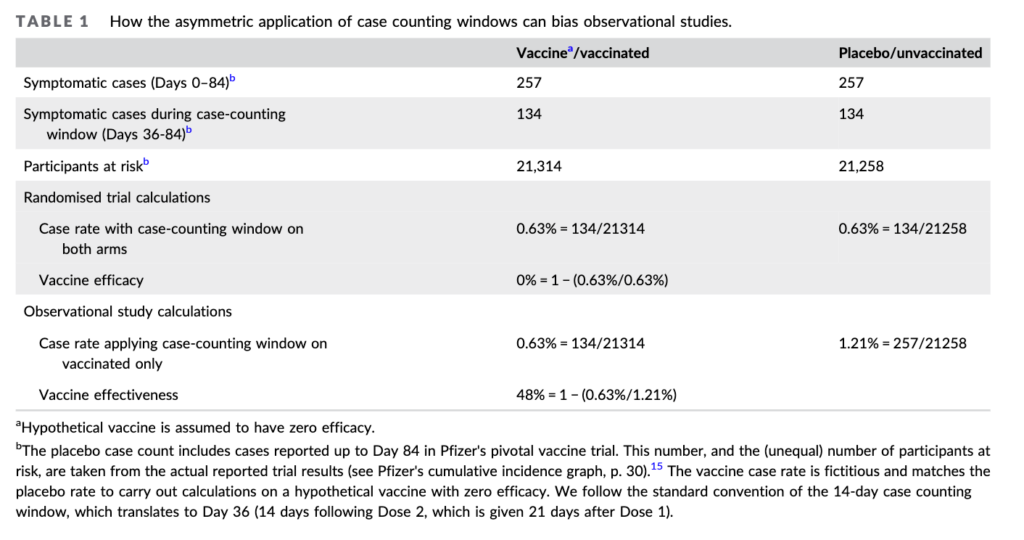
In the experiment, he says, what if we compare the control arm of the Pfizer study against an imaginary vaccine arm. And for the thought experiment assume the vaccine is useless. As the table above shows, both groups have identical numbers of covid cases— just what you would expect from a useless vaccine. A straight forward analysis shows no benefit (second to last row)
But in the ‘fictional vaccine observational study’ cases are excluded for 36 days. When this is done the useless vaccine, looks like it reduces infections by 48%!!
Doshi makes a very good point in his paper that the solution is to subtract the 36 day infection rate from the observational control arm. Sadly most investigations don’t do that.
This is one of several biases Doshi discusses, and it plagues the vaccine literature.
Author(s): Vinay Prasad
Publication Date: 14 May 2024
Publication Site: Vinay Prasad’s Observations and Thoughts, substack