Graphic:
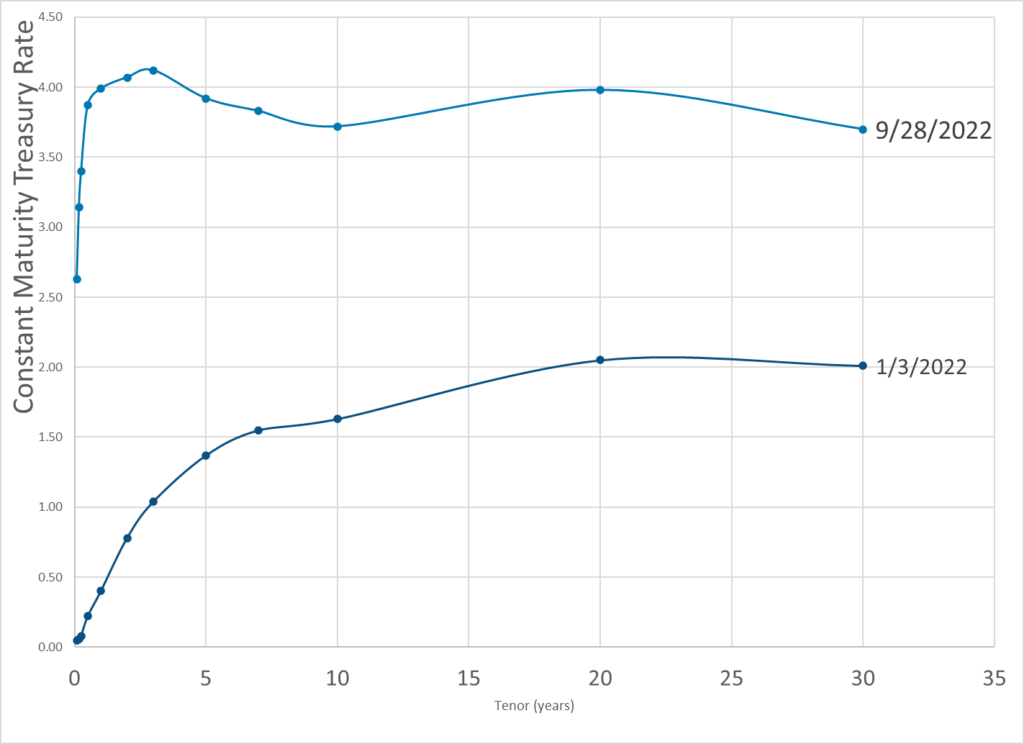
Publication Date: 28 Sept 2022
Publication Site: Dept of Treasury
All about risk
Graphic:
Publication Date: 28 Sept 2022
Publication Site: Dept of Treasury
Graphic:
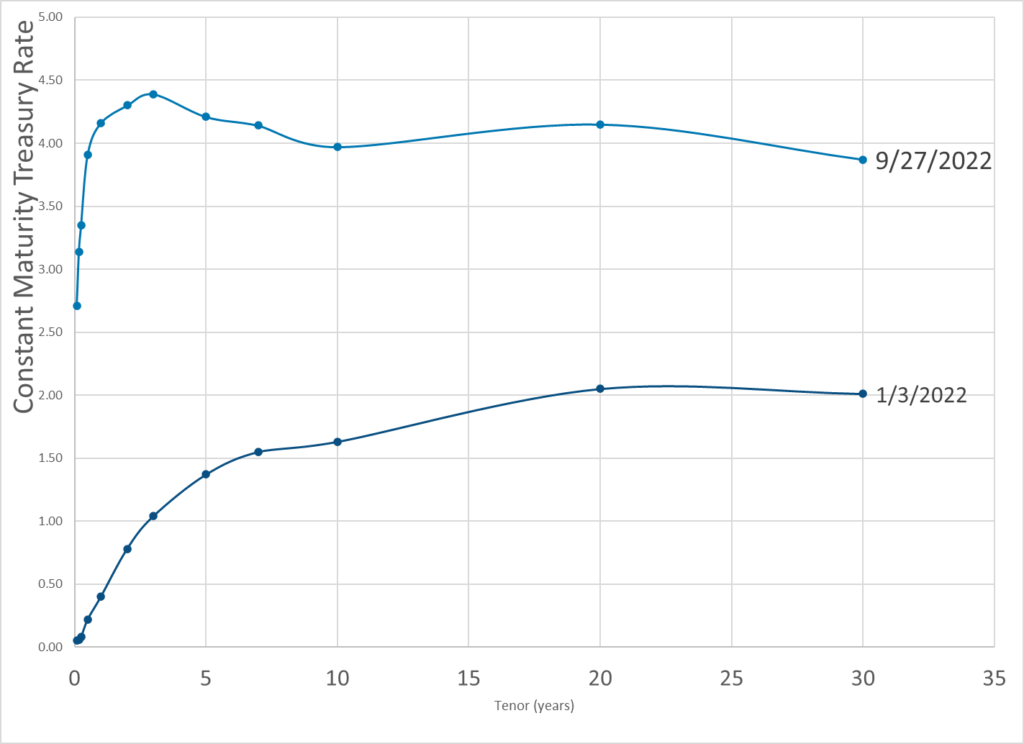
Publication Date: 27 Sept 2022
Publication Site: Department of Treasury
Graphic:
Excerpt:
Treasury Par Yield Curve Rates: These rates are commonly referred to as “Constant Maturity Treasury” rates, or CMTs. Yields are interpolated by the Treasury from the daily par yield curve. This curve, which relates the yield on a security to its time to maturity, is based on the closing market bid prices on the most recently auctioned Treasury securities in the over-the-counter market. These par yields are derived from indicative, bid-side market price quotations (not actual transactions) obtained by the Federal Reserve Bank of New York at or near 3:30 PM each trading day. The CMT yield values are read from the par yield curve at fixed maturities, currently 1, 2, 3 and 6 months and 1, 2, 3, 5, 7, 10, 20, and 30 years. This method provides a par yield for a 10-year maturity, for example, even if no outstanding security has exactly 10 years remaining to maturity.
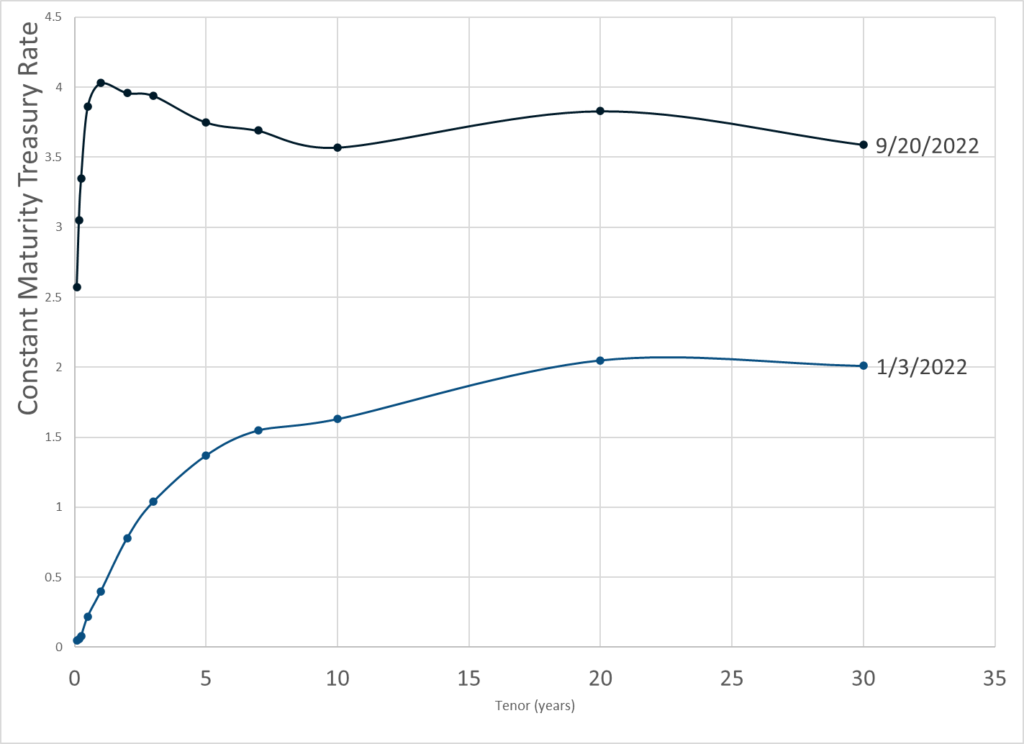
Treasury Par Yield Curve Methodology: The Treasury par yield curve is estimated daily using a monotone convex spline method. Inputs to the model are indicative bid-side prices for the most recently auctioned nominal Treasury securities. Treasury reserves the option to make changes to the yield curve as appropriate and in its sole discretion. See our Treasury Yield Curve Methodology page for details.
Author(s): Treasury Dept
Publication Date: 21 Sept 2022
Publication Site: Treasury Dept
Graphic:
Excerpt:
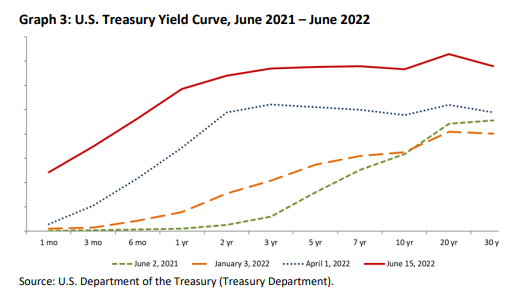
The shape of the Treasury yield curve generally provides insight into the market’s expectations for
interest rates, as well as economic activity. As of June, the yield curve has shifted higher and flattened
compared to the beginning of the year and the last year. The Federal Reserve’s recent aggressive actions
have resulted in the higher Treasury rates and a flattening of the yield curve, as many investors believe
higher rates will push the U.S. economy into a recession. The yield curve also inverted briefly in midJune, which market participants view as a recession signal.As of year-end 2021, U.S. insurers had exposure to about $316.3 billion in U.S. government bonds across
various maturities, or about 6% of total cash and invested assets. This was an increase from $280.6
billion at year-end 2020, but it was unchanged as a percentage of total cash and invested assets.
Author(s): Jennifer Johnson and Michele Wong
Publication Date: 23 June 2022
Publication Site: NAIC Capital Markets Special Report
Link: https://juliaactuary.org/tutorials/yield-curve-fitting/
Graphic:
Excerpt:
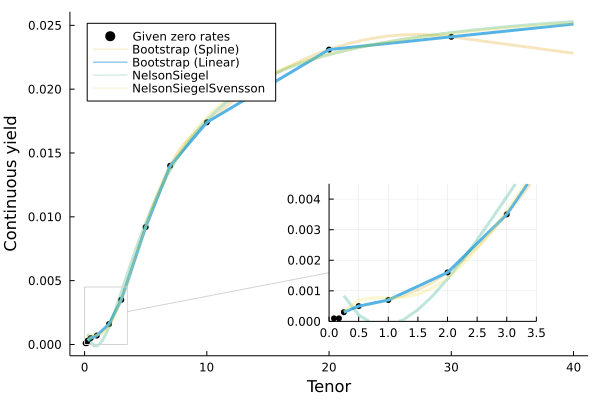
Given rates and maturities, we can fit the yield curves with different techniques in Yields.jl.
Below, we specify that the rates should be interpreted as Continuously compounded zero rates:
using Yields

rates = Continuous.([0.01, 0.01, 0.03, 0.05, 0.07, 0.16, 0.35, 0.92, 1.40, 1.74, 2.31, 2.41] ./ 100)
mats = [1/12, 2/12, 3/12, 6/12, 1, 2, 3, 5, 7, 10, 20, 30]
Then fit the rates under four methods:
Bootstrap option)ns = Yields.Zero(NelsonSiegel(), rates,mats)
nss = Yields.Zero(NelsonSiegelSvensson(), rates,mats)
b = Yields.Zero(Bootstrap(), rates,mats)
bl = Yields.Zero(Bootstrap(Yields.LinearSpline()), rates,mats)That’s it! We’ve fit the rates using four different techniques. These can now be used in a variety of ways, such as calculating the present_value, duration, or convexity of different cashflows if you imported ActuaryUtilities.jl
Publication Date: 19 Jun 2022, accessed 22 Jun 2022
Publication Site: JuliaActuary
Link:https://mishtalk.com/economics/despite-rising-bond-yields-the-yield-curve-is-still-flattening
Graphic:
Excerpt:
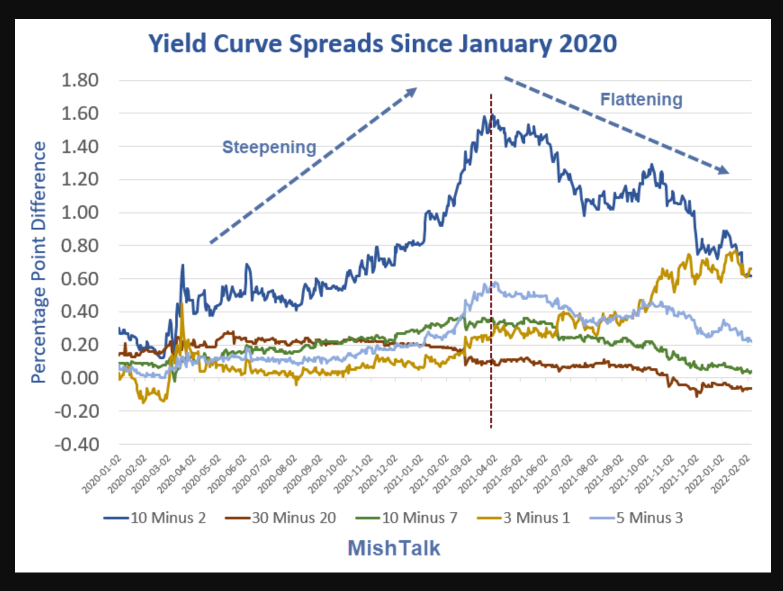
Economists like to watch the 2-10 spread because that is one of the most reliable recession indicators.
Seemingly, inversions are far away, but that is mostly an illusion.
The 2-10 spread has been sinking like a rock. That spread was 1.58 percentage points on March 19, 2021 as shown in the lead chart. It’s now down to 0.61 percentage points.
If the Fed gets in as little as two hikes, the 2-10 spread will invert as it typically does before a recession.
Of course, the 10-year yields may keep rising, but the problem is 2-year yields have risen faster.
Author(s): Mike Shedlock
Publication Date: 8 Feb 2022
Publication Site: Mish Talk
Excerpt:
Earlier this year, the $3.9 trillion market where states, cities, schools and other issuers sell debt had been resisting a steep sell off in Treasuries that lifted yields, putting the historically close correlation between the two markets out of whack.
Now, munis are catching up, with the 10-year yield on Municipal Market Data’s (MMD) benchmark triple-A scale, which started 2021 at 0.720%, climbing 45 basis points since Feb. 12. It closed up 5 basis points at 1.14% on Thursday.
The iShares National Municipal Bond exchange-traded fund (ETF) fell on Thursday to its lowest level since November at 115.14. The largest muni ETF, which reached an 11-month high of 117.95 on Feb. 11, was last down 0.43% at 115.30.
Author(s): Karen Pierog
Publication Date: 25 February 2021
Publication Site: Reuters
Excerpt:
Long-term Treasury yields have been rising much faster than shorter-term yields, a sign that investors are betting on further acceleration in the U.S.’s economic recovery.
The steepness (or flatness) of the yield curve—the change in yields across different Treasury maturities—is seen as an indicator of economic growth. When the curve “inverts,” or long-term yields fall below short term yields, it is seen as a recession warning. Now the curve is getting steeper, a sign that investors expect stronger U.S. growth and inflation…
Author: Alexandra Scaggs
Publication Date: 4 February 2021
Publication Site: Barron’s