New York City Wants to Amp Up Risk in Workers’ Pensions

Link: https://www.wsj.com/articles/new-york-city-wants-to-amp-up-risk-in-workers-pensions-11650976985

Graphic:
Excerpt:

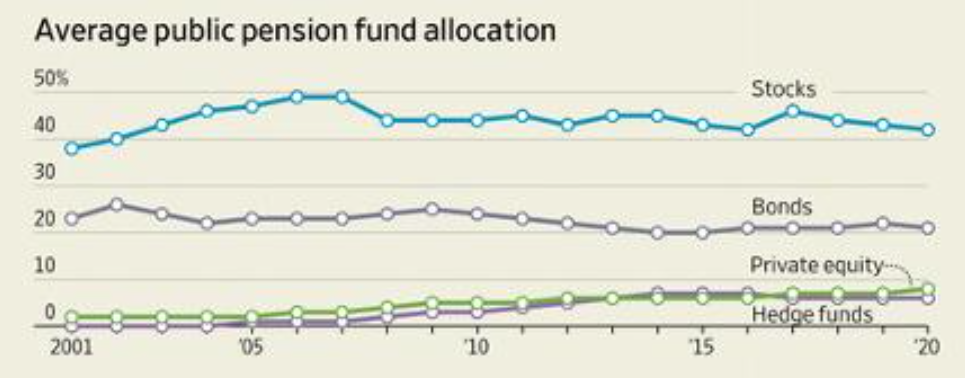
New York City’s comptroller is the latest public official trying to change laws aimed at limiting risk in pension investments, as U.S. state and local pension funds try to plug shortfalls in a low-return environment.

Comptroller Brad Lander, who oversees about $260 billion in retirement money for city police, firefighters, teachers and other public workers, is asking New York lawmakers for more flexibility to invest in private markets, high-yield debt and foreign stocks. The state comptroller’s office, which supervises another $280 billion in retirement assets, views the idea favorably, with a representative saying such flexibility “is key in times of market volatility.”

Pension funds, like household investors, are facing a relatively bleak environment for stocks and bonds, the bread and butter of a traditional retirement portfolio. In the face of historic inflation and Federal Reserve efforts to contain it, these funds are finding they can no longer rely on bonds to rise when equities fall and vice versa. In the first quarter, the S&P 500 returned minus 4.6% while the Bloomberg U.S. Aggregate bond index returned minus 5.93%.

“Those two things taken together is what’s scary: the prospect of both going down at the same time,” said Steve Foresti, chief investment officer at Wilshire Associates, which advises large public pension funds. Retirement portfolio managers, he said, are asking “in that environment, do I have anything that actually goes up?”

Author(s): Heather Gillers

Publication Date: 26 April 2022

Publication Site: WSJ
2022: A Great Opportunity for the Disability Insurance Market

Link: https://www.genre.com/knowledge/blog/2022-a-great-opportunity-for-the-disability-insurance-market-en.html

Graphic:

Excerpt:

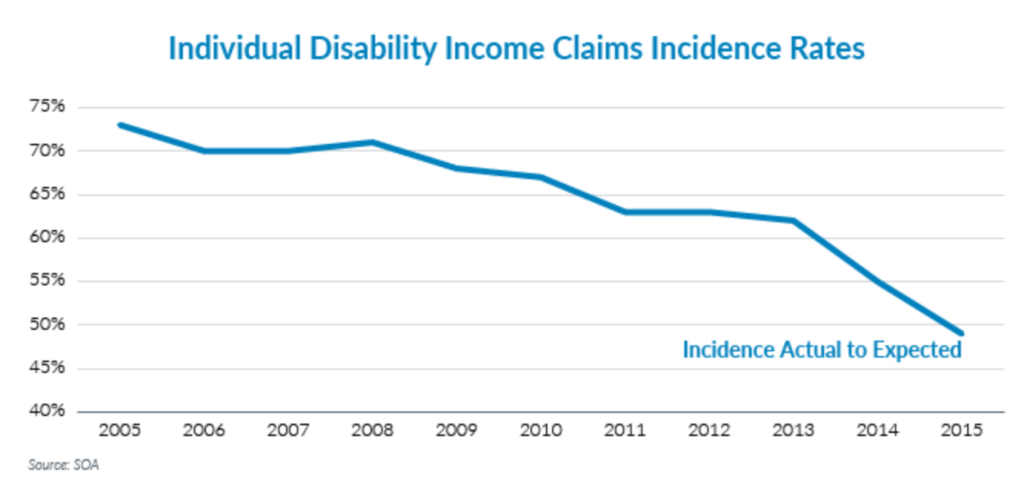
Second, one of the key drivers of these stable and low benefit ratios has been steady-to-declining rates of claims incidence. In a recent paper published by the SOA and co‑authored by Gen Re’s Jay Barriss, Individual Disability incidence rates were shown to have steadily improved over the 2005 to 2015 period, relative to the latest Individual Disability Valuation Table (IDIVT) incidence rate expectations.10 The favorable incidence rate trends have likely continued into at least into 2020 as Gen Re analysis on our reinsured blocks of disability business show continuing-to-stable incidence trends since 2015.

Author(s): Mike Krohn

Publication Date: 3 May 2022

Publication Site: Gen Re

Covid-19’s full death toll is nearly three times higher than reported, WHO data suggests

Link: https://www.cnn.com/2022/05/05/health/covid-excess-mortality-who-data/index.html

Excerpt:

About 14.9 million people around the world died as a direct or indirect result of Covid-19 in the period between January 1, 2020, and December 31, 2021, according to new estimates from the World Health Organization — nearly three times more deaths than were officially reported.

There were 5.4 million Covid-19 deaths reported to WHO during that timeframe, resulting in an excess mortality estimate of 9.5 million more deaths than what was reported.

“Excess mortality is the difference between the number of deaths that have been recorded and those that would be expected in the absence of the pandemic,” said Samira Asma, assistant director-general for the Data, Analytics and Delivery for Impact Division of WHO.

Author(s): Carma Hassan

Publication Date: 6 May 2022

Publication Site: CNN

Private Overborrowing Under Sovereign Risk

Link: https://www.chicagofed.org/publications/working-papers/2022/2022-17

Graphic:

Abstract:

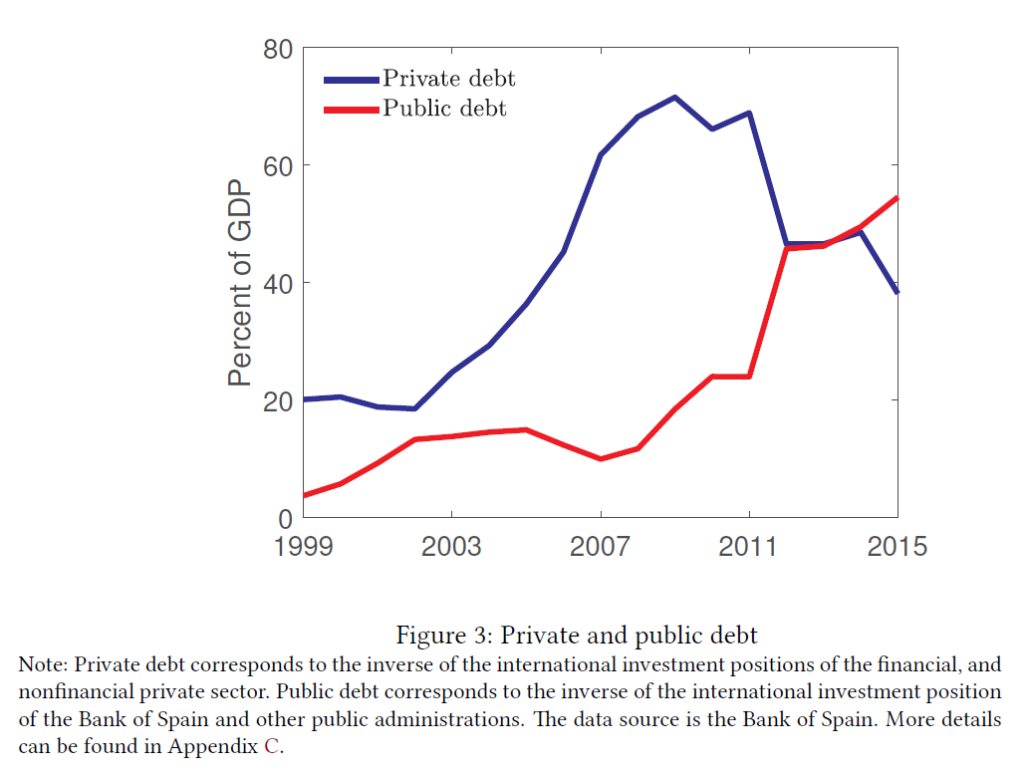
This paper proposes a quantitative theory of the interaction between private and public debt in an open economy. Excessive private debt increases the frequency of financial crises. During such crises the government provides fiscal bailouts financed with risky public debt. This response may cause a sovereign debt crisis, which is characterized by a higher probability of a sovereign default. The model is quantitatively consistent with the evolution of private debt, public debt, and sovereign spreads in Spain from 1999 to 2015, and provides an estimate of the degree of overborrowing, its effect on the spreads, and the optimal macroprudential policy.

Author(s): Fernando Arce

Publication Date: May 2022

Publication Site: Chicago Fed

Diversity At the Fed and ECB? There is None, It’s a Big Self-Serving Lie

Link: https://mishtalk.com/economics/diversity-at-the-fed-and-ecb-there-is-none-its-a-big-self-serving-lie

Graphic:

Tweet link:

Excerpt:

At the ECB, you better be gung-ho pro-EU. You better believe negative interest rates are a good idea. And you must back the idea that targeting 2% inflation makes sense.

Finally, if somehow you find yourself at the ECB disagreeing with any of those things, you are expected to shut your mouth so the consensus view never shows any dissent.

….

At FRBNY, I recall the people who ran Treasury markets, money markets, etc. literally had no relevant experience or expertise. The job of staff was to make them appear competent, but it didn’t really matter what they did because Fed can’t fail and they can’t get fired.  

This creates a culture where anyone with talent or ambition GTFO ASAP. There are exceptions, but those who rise tend to be those who have no where else go. It’s a weird structure where the higher you go, the more incompetent you are.

So it’s no surprise Fed is failing

Author(s): Mike Shedlock

Publication Date: 13 May 2022

Publication Site: Mish Talk

Achievements in Public Health, 1900-1999: Healthier Mothers and Babies

Link: https://www.cdc.gov/mmwr/preview/mmwrhtml/mm4838a2.htm

Graphic:

Excerpt:

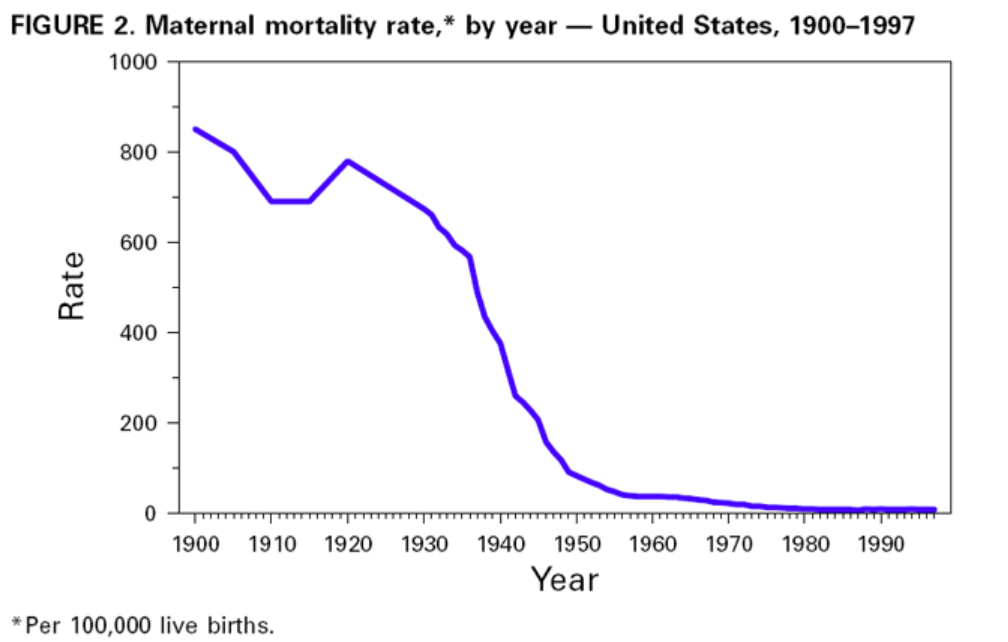
Despite the dramatic decline in infant and maternal mortality during the 20th century, challenges remain. Perhaps the greatest is the persistent difference in maternal and infant health among various racial/ethnic groups, particularly between black and white women and infants. Although overall rates have plummeted, black infants are more than twice as likely to die as white infants; this ratio has increased in recent decades. The higher risk for infant mortality among blacks compared with whites is attributed to higher LBW incidence and preterm births and to a higher risk for death among normal birthweight infants (greater than or equal to 5 lbs, 8 oz [greater than or equal to 2500 g]) (18). American Indian/ Alaska Native infants have higher death rates than white infants because of higher SIDS rates. Hispanics of Puerto Rican origin have higher death rates than white infants because of higher LBW rates (19). The gap in maternal mortality between black and white women has increased since the early 1900s. During the first decades of the 20th century, black women were twice as likely to die of pregnancy-related complications as white women. Today, black women are more than three times as likely to die as white women.

During the last few decades, the key reason for the decline in neonatal mortality has been the improved rates of survival among LBW babies, not the reduction in the incidence of LBW. The long-term effects of LBW include neurologic disorders, learning disabilities, and delayed development (20). During the 1990s, the increased use of assisted reproductive technology has led to an increase in multiple gestations and a concomitant increase in the preterm delivery and LBW rates (21). Therefore, in the coming decades, public health programs will need to address the two leading causes of infant mortality: deaths related to LBW and preterm births and congenital anomalies. Additional substantial decline in neonatal mortality will require effective strategies to reduce LBW and preterm births. This will be especially important in reducing racial/ethnic disparities in the health of infants.

Approximately half of all pregnancies in the United States are unintended, including approximately three quarters among women aged less than 20 years. Unintended pregnancy is associated with increased morbidity and mortality for the mother and infant. Lifestyle factors (e.g., smoking, drinking alcohol, unsafe sex practices, and poor nutrition) and inadequate intake of foods containing folic acid pose serious health hazards to the mother and fetus and are more common among women with unintended pregnancies. In addition, one fifth of all pregnant women and approximately half of women with unintended pregnancies do not start prenatal care during the first trimester. Effective strategies to reduce unintended pregnancy, to eliminate exposure to unhealthy lifestyle factors, and to ensure that all women begin prenatal care early are important challenges for the next century.

Author(s): Division of Reproductive Health, National Center for Chronic Disease Prevention and Health Promotion, CDC.

Publication Date: 1 October 1999

Publication Site: CDC MMWR

SFA Update – Two Refilers

Link: https://burypensions.wordpress.com/2022/05/20/sfa-update-two-refilers/

Graphic:

Excerpt:

The PBGC Special Financial Assistance program for troubled multiemployer plans weekend update showed a refiling of a prior withdrawal (America’s Family Benefit Retirement Plan) that asked for $4,.5 million less and one withdrawal and immediate refile (UTWA NJ Union Employer Pension Plan) that asked for $17,918 more.

Author(s): John Bury

Publication Date: 20 May 2022

Publication Site: burypensions

Year 2000 Standard Million Population for the United States — Age-Adjusted Rates

Link: https://wonder.cdc.gov/wonder/help/ucd.html#Age-Adjusted%20Rates

Graphic:

Excerpt:

Age-Adjusted Rates

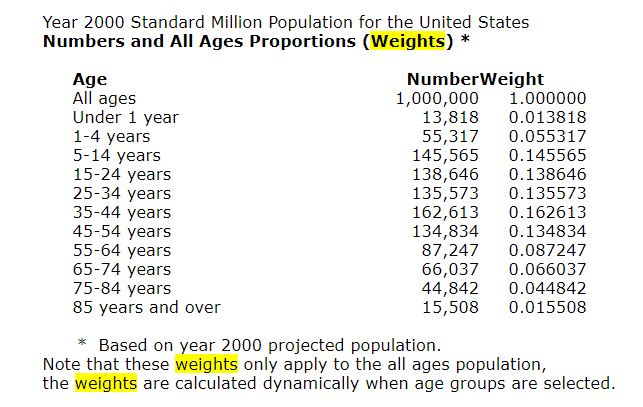
Age-adjusted death rates are weighted averages of the age-specific death rates, where the weights represent a fixed population by age. They are used to compare relative mortality risk among groups and over time. An age-adjusted rate represents the rate that would have existed had the age-specific rates of the particular year prevailed in a population whose age distribution was the same as that of the fixed population. Age-adjusted rates should be viewed as relative indexes rather than as direct or actual measures of mortality risk.

The year “2000 U.S. standard” is the default population selection for the calculation of age-adjusted rates. However, you can select other standard populations, or select specific population criteria to determine the age distribution ratios. See Frequently Asked Questions about Death Rates for more information.

The rates of almost all causes of death vary by age. Age adjustment is a technique for “removing” the effects of age from crude rates, so as to allow meaningful comparisons across populations with different underlying age structures. For example, comparing the crude rate of heart disease in Florida to that of California is misleading, because the relatively older population in Florida will lead to a higher crude death rate, even if the age-specific rates of heart disease in Florida and California are the same. For such a comparison, age-adjusted rates are preferable. Age-adjusted rates should be viewed as relative indexes rather than as direct or actual measures of mortality risk.

The National Center for Health Statistics (NCHS) age-adjusts death rates using the direct method. That is, by applying age-specific death rates (Ri) to the U.S. standard population age distribution.

R’ = S i ( Psi / Ps ) R i

where Psi is the standard population for age group i and Ps is the total U.S. standard population (all ages combined).

In the direct method, a standard age distribution is chosen and the age-specific death rates are weighted according to the standard. A reasonable choice for the standard is the U.S. total population (all races, both genders) for the year under study. To permit comparison of death rates from year to year, a standard population is used. Beginning with the 1999 data year, NCHS adopted the year 2000 projected population of the United States as the standard population. This new standard replaces the 1940 standard population that was used by NCHS for over 50 years. The new population standard affects the level of mortality and to some extent trends and group comparisons. Of particular note are the effects on race comparison of mortality. For detailed discussion, see:Anderson RN, Rosenberg HM. Age standardization of death rates: Implementation of the year 2000 standard. National Vital Statistics Reports; vol 47 no 3. Hyattsville, Maryland. National Center for Health Statistics. 1998.Beginning with publications of the year 2003 data, the traditional standard million population along with corresponding standard weights to six decimal places were replaced by the projected year 2000 population age distribution (see 2000 Standard Population below). The effect of the change is negligible and does not significantly affect comparability with age-adjusted rates calculated using the previous method.

Publication Date: Accessed 21 May 2022, last reviewed 2 March 2022

Publication Site: CDC WONDER

When Harry Fired Sally: The Double Standard in Punishing Misconduct

Link: https://www.journals.uchicago.edu/doi/abs/10.1086/718964

Abstract:

We examine gender differences in misconduct punishment in the financial advisory industry. There is a “gender punishment gap”: following an incident of misconduct, female advisers are 20% more likely to lose their jobs and 30% less likely to find new jobs, relative to male advisers. The gender punishment gap is not driven by gender differences in occupation, productivity, nature of misconduct, or recidivism. The gap in hiring and firing dissipates at firms with a greater percentage of female managers and executives. We also explore the differential treatment of ethnic minority men and find similar patterns of “in-group” tolerance.

Author(s): Mark Egan, Gregor Matvos, and Amit Seru

Publication Date: May 2022

Publication Site: Journal of Political Economy; Volume 130, Number 5

NJ Actuarial Reports – The Believable Numbers 6/30/21

Link: https://burypensions.wordpress.com/2022/04/29/nj-actuarial-reports-the-believable-numbers-6-30-21/

Graphic:

Excerpt:

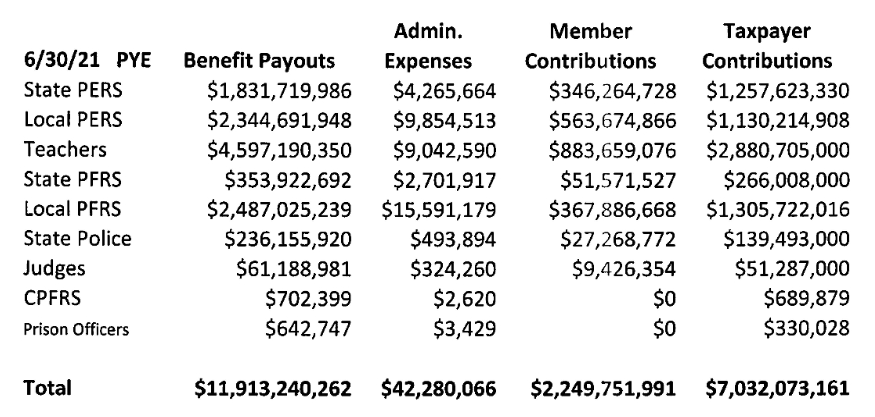
The June 30, 2021 actuarial reports for the New Jersey Retirement System are now all out and there are a few numbers therein that can be taken seriously (none involving liabilities or even the market value of assets considering all those self-valued alternative investments). The main purpose of these official actuarial reports is to determine the ‘required’ contributions which practically all parties have a vested interest in understating so we get a bunch of fanciful numbers where possible. However, these numbers you can’t pretty up:

Author(s): John Bury

Publication Date: 28 April 2022

Publication Site: burypensions

The 2022 Policygenius Life Insurance Trend Report

Link: https://www.policygenius.com/life-insurance/life-insurance-trend-report-2022/

Graphic:

Excerpt:

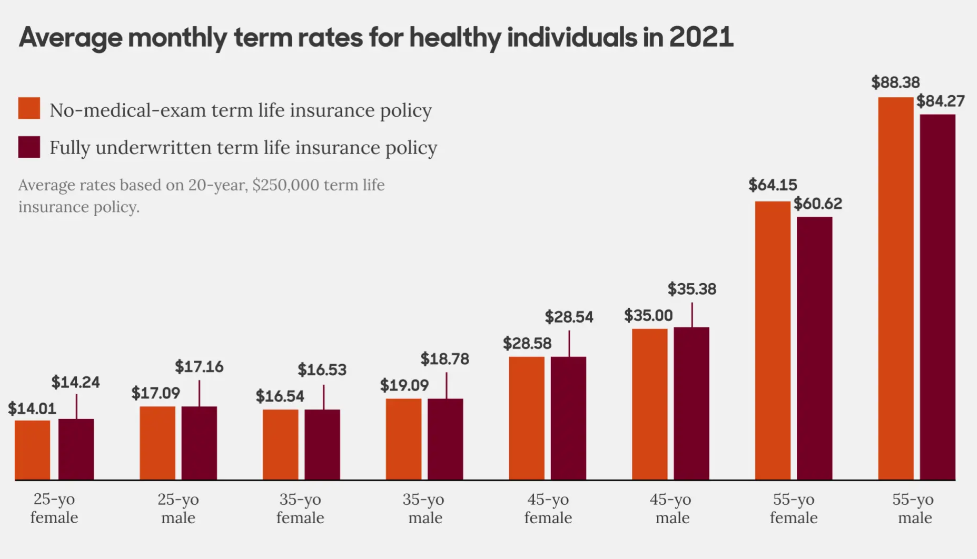
The marketplace has experienced a surge in insurance companies offering no-medical-exam life insurance — and accelerated underwriting options in particular — that satisfy the growing demand for quick, contactless coverage. 

“We went from having three [AU options] in early 2020 to seven in 2021, with more on the horizon for 2022,” says Eloise Spinello, associate director of account management at Policygenius. “More insurers are adjusting to demand by offering no-med options that account for all health classes as well, rather than reserving these options for only the healthiest applicants.” 

In addition to their convenience, accelerated underwriting policies are frequently one of the most affordable options for shoppers. Policygenius Life Insurance Price Index data from the last year shows that no-medical-exam term insurance policies are competitively priced compared to term policies requiring a full medical exam — and some applicants even paid less for no-medical-exam term coverage. For example, 25-year-old females buying $250,000 in coverage paid 1.6% less in 2021 for a no-medical-exam term policy than they did for a traditional policy. 

Author(s): Nupur Gambhir & Amanda Shih

Publication Date: 2 February 2022

Publication Site: Policygenius

How the Inflation Rate Is Measured: 477 Government Workers at Grocery Stores

Link: https://www.wsj.com/articles/inflation-bls-price-checkers-who-determine-cpi-11652132333?page=1

Excerpt:

Ms. Mascitis, 50, who has been working as a BLS price checker since 2013, describes her job as “a treasure hunt.”

She set out on her route one day in April with a list of items to price. First stop: a locally owned auto-repair shop in an up-and-coming part of Philadelphia, where she is to record the total cost for a rear-brake job, wheel-bearing hull assembly replacement and full brake replacement.

The mechanic tells her about the rising costs of running the shop. He says he will have to move his office to a less-expensive part of town. He says some customers are holding off on fixing their cars and taking public transit because of high repair costs.

“It’s a mess,” she agrees.

After 10 minutes, the mechanic calls his parts supplier to find out the most up-to-date material costs.

“And is sales tax on materials and labor still 8%?” Ms. Mascitis asks. Yes, the mechanic confirms.

…..

“We have very strict data-collection rules. Someone running a store isn’t trained in CPI’s data-collection rules,” says Ms. Greene, who supervises Ms. Mascitis and 65 price checkers in a region that includes New Jersey, Pennsylvania, Delaware, Maryland, Washington, D.C., Virginia and West Virginia. She adds that it would be a burden on stores to expect them to do what CPI does. “They would say this is good enough, and good enough is not usually good enough for us.”

Author(s): Rachel Wolfe

Publication Date: 10 May 2022

Publication Site: WSJ