The New York City Unions Whose Backdoor Deal Sold Out Retirees, Helped Insurance Industry

Link: https://www.newsweek.com/new-york-city-unions-whose-backdoor-deal-sold-out-retirees-helped-insurance-industry-1604661

Excerpt:

In recent years, leadership of some of the nation’s largest unions have publicly opposed single-payer health care proposals, angering their rank-and-file and forcing Democratic politicians who back single-payer to take on a key constituency.

In New York City, for example, the umbrella organization for the city’s public sector unions—the Municipal Labor Committee (MLC)—recently helped the health insurance industry block a statewide single-payer bill, on the grounds that their members wanted to keep the health care benefits for which they had sacrificed wage increases.

But it turns out that the MLC, which bargains for health care benefits for city unions, was also engaging in backdoor negotiations with the city, resulting in a proposal to switch nearly a quarter-million people from Medicare to privately administered Medicare Advantage plans.

…..

Following the 2018 cost-cutting agreement, union leaders and officials came up with eight proposals to meet the cost-cutting requirements, including switching to a statewide single-payer system or setting up a self-insurance system.

A January 2021 study by The New School found that the city could save about $1.6 billion per year if it adopted a self-insurance program, as most major cities and large companies have done. That would involve setting up a health insurance plan just for the city’s employees and paying for claims directly, rather than paying premiums to a health insurance company which tends to be more expensive because insurance company profit margins are so large.

But since the negotiations between the MLC and Office of Labor Relations were held behind closed doors, retirees don’t know whether this option was ever considered.

Author(s): JULIA ROCK, THE DAILY POSTER

Publication Date: 28 June 2021

Publication Site: Newsweek
It’s Worse than “Reverse” – The Full Case Against Ultra Low and Negative Interest Rates

Link: https://www.ineteconomics.org/research/research-papers/its-worse-than-reverse-the-full-case-against-ultra-low-and-negative-interest-rates

Paper: https://www.ineteconomics.org/uploads/papers/WP_151-White-NegativeInterestRates.pdf

Abstract:

It is becoming increasingly accepted that lowering interest rates might at some point prove contractionary (the “reversal interest rate”) if lower lending margins cut the supply of bank loans. This paper argues that there are many other reasons to question reliance on monetary policy to provide economic stimulus, particularly over successive financial cycles. By encouraging the issue of debt, often for unproductive purposes, monetary stimulus becomes increasingly ineffective over time. Moreover, it threatens financial stability in a variety of ways, it leads to real resource misallocations that lower potential growth, and it finally produces a policy “debt trap” that cannot be escaped without significant economic costs. Debt-deflation and high inflation are both plausible outcomes.

https://doi.org/10.36687/inetwp151

Author(s): William White

Publication Date: 5 March 2021

Publication Site: Institute for New Economic Thinking

Effect of the covid-19 pandemic in 2020 on life expectancy across populations in the USA and other high income countries: simulations of provisional mortality data

Link: https://www.bmj.com/content/373/bmj.n1343

Graphic:

Excerpt:

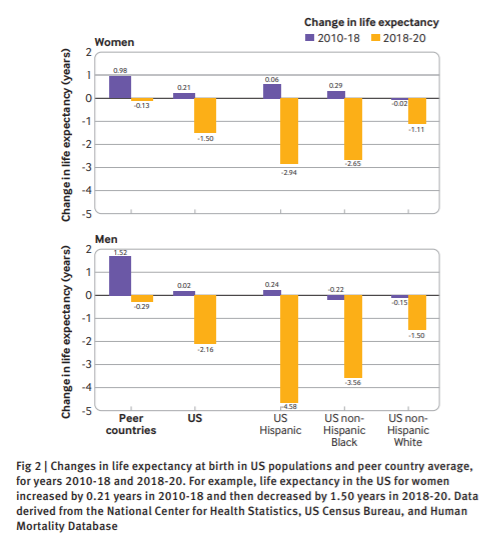
Results Between 2010 and 2018, the gap in life expectancy between the US and the peer country average increased from 1.88 years (78.66 v 80.54 years, respectively) to 3.05 years (78.74 v 81.78 years). Between 2018 and 2020, life expectancy in the US decreased by 1.87 years (to 76.87 years), 8.5 times the average decrease in peer countries (0.22 years), widening the gap to 4.69 years. Life expectancy in the US decreased disproportionately among racial and ethnic minority groups between 2018 and 2020, declining by 3.88, 3.25, and 1.36 years in Hispanic, non-Hispanic Black, and non-Hispanic White populations, respectively. In Hispanic and non-Hispanic Black populations, reductions in life expectancy were 18 and 15 times the average in peer countries, respectively. Progress since 2010 in reducing the gap in life expectancy in the US between Black and White people was erased in 2018-20; life expectancy in Black men reached its lowest level since 1998 (67.73 years), and the longstanding Hispanic life expectancy advantage almost disappeared.

Conclusions The US had a much larger decrease in life expectancy between 2018 and 2020 than other high income nations, with pronounced losses among the Hispanic and non-Hispanic Black populations. A longstanding and widening US health disadvantage, high death rates in 2020, and continued inequitable effects on racial and ethnic minority groups are likely the products of longstanding policy choices and systemic racism.

BMJ 2021; 373 doi: https://doi.org/10.1136/bmj.n1343 (Published 24 June 2021)Cite this as: BMJ 2021;373:n1343

Author(s): Steven H Woolf, Ryan K Masters, Laudan Y Aron

Publication Date: 24 June 2021

Publication Site: bmj

Black and Hispanic Americans Suffer Most in Biggest US Decline in Life Expectancy Since WWII

Excerpt:

Indeed, new research published Wednesday in the BMJ shows just how wide that gap has grown. Life expectancy across the country plummeted by nearly two years from 2018 to 2020, the largest decline since 1943, when American troops were dying in World War II, according to the study. But while white Americans lost 1.36 years, Black Americans lost 3.25 years and Hispanic Americans lost 3.88 years. Given that life expectancy typically varies only by a month or two from year to year, losses of this magnitude are “pretty catastrophic,” said Dr. Steven Woolf, a professor at Virginia Commonwealth University and lead author of the study.

Over the two years included in the study, the average loss of life expectancy in the U.S. was nearly nine times greater than the average in 16 other developed nations, whose residents can now expect to live 4.7 years longer than Americans. Compared with their peers in other countries, Americans died not only in greater numbers but at younger ages during this period.

The U.S. mortality rate spiked by nearly 23% in 2020, when there were roughly 522,000 more deaths than normally would be expected. Not all of these deaths were directly attributable to covid-19. Fatal heart attacks and strokes both increased in 2020, at least partly fueled by delayed treatment or lack of access to medical care, Woolf said. More than 40% of Americans put off treatment during the early months of the pandemic, when hospitals were stretched thin and going into a medical facility seemed risky. Without prompt medical attention, heart attacks can cause congestive heart failure; delaying treatment of strokes raises the risk of long-term disability.

Author(s): Liz Szabo

Publication Date: 24 June 2021

Publication Site: Kaiser Health News

Database: New York’s pension system hits record returns. Here’s who is getting the most

Link: https://www.poughkeepsiejournal.com/story/news/politics/2021/06/01/database-nys-pension-system-gets-record-returns-who-earned-most/5254524001/

Excerpt:

A rebound in the financial markets after the start of the COVID-19 pandemic fueled record growth in the state’s pension fund for government workers.

The pension fund for 1.1 million employees and retirees grew a whopping 33.6% for the fiscal year that ended March 31, Comptroller Thomas DiNapoli announced Wednesday.

The return on investments increased the fund’s value to nearly $255 billion, making it one of the largest public pension funds in the nation.

….

The fund’s long-term expected rate of return is 6.8%.

The health of the fund is critical to its 673,000 active workers and 447,000 retirees, and it comes as more public sector employees are retiring, a review of state records showed.

Author(s): Joseph Spector, Sean Lahman

Publication Date: 1 June 2021

Publication Site: Poughkeepsie Journal

Opinion: Amid a Pandemic, a Health Care Algorithm Shows Promise and Peril

Excerpt:

In the midst of the uncertainty, Epic, a private electronic health record giant and a key purveyor of American health data, accelerated the deployment of a clinical prediction tool called the Deterioration Index. Built with a type of artificial intelligence called machine learning and in use at some hospitals prior to the pandemic, the index is designed to help physicians decide when to move a patient into or out of intensive care, and is influenced by factors like breathing rate and blood potassium level. Epic had been tinkering with the index for years but expanded its use during the pandemic. At hundreds of hospitals, including those in which we both work, a Deterioration Index score is prominently displayed on the chart of every patient admitted to the hospital.

The Deterioration Index is poised to upend a key cultural practice in medicine: triage. Loosely speaking, triage is an act of determining how sick a patient is at any given moment to prioritize treatment and limited resources. In the past, physicians have performed this task by rapidly interpreting a patient’s vital signs, physical exam findings, test results, and other data points, using heuristics learned through years of on-the-job medical training.

Ostensibly, the core assumption of the Deterioration Index is that traditional triage can be augmented, or perhaps replaced entirely, by machine learning and big data. Indeed, a study of 392 Covid-19 patients admitted to Michigan Medicine that the index was moderately successful at discriminating between low-risk patients and those who were at high-risk of being transferred to an ICU, getting placed on a ventilator, or dying while admitted to the hospital. But last year’s hurried rollout of the Deterioration Index also sets a worrisome precedent, and it illustrates the potential for such decision-support tools to propagate biases in medicine and change the ways in which doctors think about their patients.

Author(s): VISHAL KHETPAL, NISHANT SHAH

Publication Date: 27 May 2021

Publication Site: Undark Magazine

Germany federal fiscal court demands changes to pension taxation

Link: https://www.jurist.org/news/2021/06/germany-federal-fiscal-court-demands-changes-to-pension-taxation/

Excerpt:

Germany’s Federal Fiscal Court, the Bundesfinanzhof, demanded changes Monday to pension taxation to avoid future double taxation of retirement savings.

Prior to 2005, pensions had been basically tax-exempt because contributions came from taxed salaries. Under a 2005 law change, pension contribution payments gradually become tax-free. However, the taxable share of the pension increased. Because of the change, there is the potential of double taxation during the transition period if the tax-exempt portion of the pension is less than the contributions made earlier from taxed salaries.

A married couple who were assessed together for income tax purposes in 2009 filed a complaint against the rules, alleging that their 2009 tax assessment was unlawful. The court rejected the complaint as unfounded, stating that the plaintiffs had not been violated of their rights.

Author(s): Cassie Maas

Publication Date: 1 June 2021

Publication Site: Jurist

Elorza’s pension proposal relies on a risky approach and an adviser linked with 38 Studios

Link: https://thepublicsradio.org/article/why-elorzas-latest-proposed-pension-fix-faces-a-lot-of-questions-

Excerpt:

Providence’s pension crisis has its roots in the late 1980s. That’s when the city’s Retirement Board approved unusually generous compounded cost of living adjustments for more than 2,500 city workers and retirees. Decades later, that move helps explain why there’s a $1.2 billion gap between the pension balance and the amount owed to current and future retirees.

The pension crisis has defied attempted solutions for years. Providence officials say the city has just 22% of the money needed to meet its long-term pension obligations. And the amount of the city budget consumed by the pension is growing 5 percent a year, to about $93 million currently. Without a change, that annual payment will rise to $227 million by 2040.

Mayor Jorge Elorza said these pension costs are unsustainable.

“It’s only a matter of time before they continue to squeeze everything else out of our budget, so that we’re cutting deeper and deeper into the bone,” he said during a recent news conference.

Elorza’s plan involves selling $704 million in pension obligation bonds. The idea is that these bonds could generate enough of a return to boost the pension system’s funding to more than 60 percent.

Author(s): Ian Donnis

Publication Date: 1 June 2021

Publication Site: The Public’s Radio

Report: Teacher pension error traced to single miscalculation in April 2015

Link: https://www.thecentersquare.com/pennsylvania/report-teacher-pension-error-traced-to-single-miscalculation-in-april-2015/article_34d84a56-c306-11eb-a252-4b78895ea004.html

Excerpt:

The calculation error that upended the state’s largest pension fund has been traced back to a single month in 2015, according to an investigation from Spotlight PA.

The discovery came to light in a trove of documents obtained by reporters that found a tiny discrepancy that boosted the $64 billion Public School Employees Retirement System (PSERS) by a third of a percentage point in April of that year.

The consultant firm hired to review PSERS’ investment returns between 2011 and 2020, ACA Compliance Group, performed limited checks that skipped over the month in question, according to the report. The company that crunched the actual numbers, Aon, blamed the discrepancy on a data entry error.

No matter the fault, the miscalculation unraveled PSERS’ rate of return, dropping it from just above the mandated 6.36% threshold to prevent a contribution increase down to 6.34%. Now, about 100,000 workers who joined the system in 2011 or later will pay more beginning on July 1.

Author(s): Christen Smith

Publication Date: 1 June 2021

Publication Site: The Center Square

The four most urgent questions about long COVID

Link: https://www.nature.com/articles/d41586-021-01511-z?mc_cid=20dfd80450&mc_eid=983bcf5922

Graphic:

Excerpt:

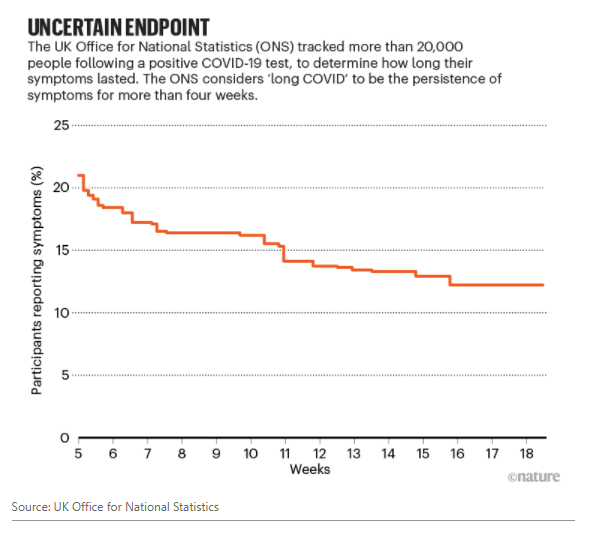
But most people with COVID-19 are never ill enough to be hospitalized. The best way to assess the prevalence of long COVID is to follow a representative group of people who have tested positive for the virus. The UK Office of National Statistics (ONS) has done just that, by following more than 20,000 people who have tested positive since April 2020 (see ‘Uncertain endpoint’). In its most recent analyses, published on 1 April, the ONS found that 13.7% still reported symptoms after at least 12 weeks (there is no widely agreed definition of long COVID, but the ONS considers it to be COVID-19 symptoms that last more than 4 weeks).

…..

In other words, more than one in 10 people who became infected with SARS-CoV-2 have gone on to get long COVID. If the UK prevalence is applicable elsewhere, that’s more than 16 million people worldwide.

The condition seems to be more common in women than in men. In another ONS analysis, 23% of women and 19% of men still had symptoms 5 weeks after infection. That is “striking”, says Rachael Evans, a clinician scientist at the University of Leicester, UK, and a member of the Post-Hospitalisation COVID-19 study (PHOSP-COVID). “If you’re male and get COVID, you’re more likely to go to hospital and you’re more likely to die. Yet if you survive, actually it’s females that are much more likely to get the ongoing symptoms.”

Author(s): Michael Marshall

Publication Date: 9 June 2021

Publication Site: Nature

Pandemic moving study: How remote work spurred moves out of big cities

Link: https://www.allconnect.com/blog/covid-moving-trends

Graphic:

Excerpt:

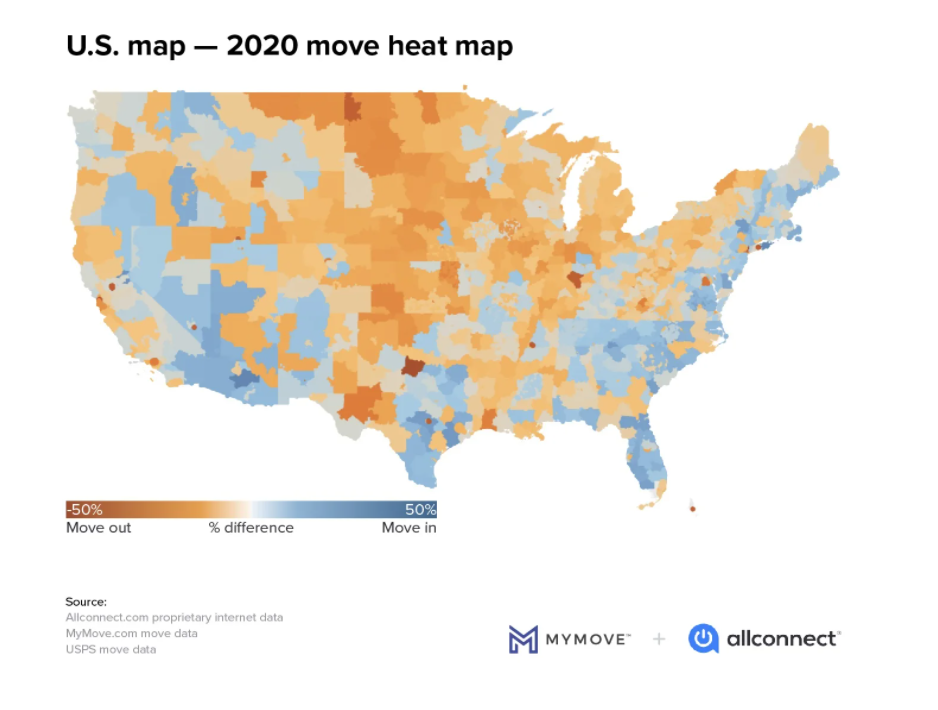
Seemingly overnight, the COVID-19 pandemic launched millions of Americans into a massive work-from-home experiment, with roughly 7 in 10 workers who could work remotely doing so in May 2020. 

But from a bird’s eye view, the way Americans moved in 2020 looks pretty much the same as it has for years. More people moved out of the biggest cities than moved in, while smaller cities and suburbs grew — especially in Arizona, Florida and Texas.

Author(s): Joe Supan

Publication Date: 27 May 2021

Publication Site: allconnect.com

Data visualisation using R, for researchers who don’t use R

Link: https://psyarxiv.com/4huvw

Graphic:

Abstract:

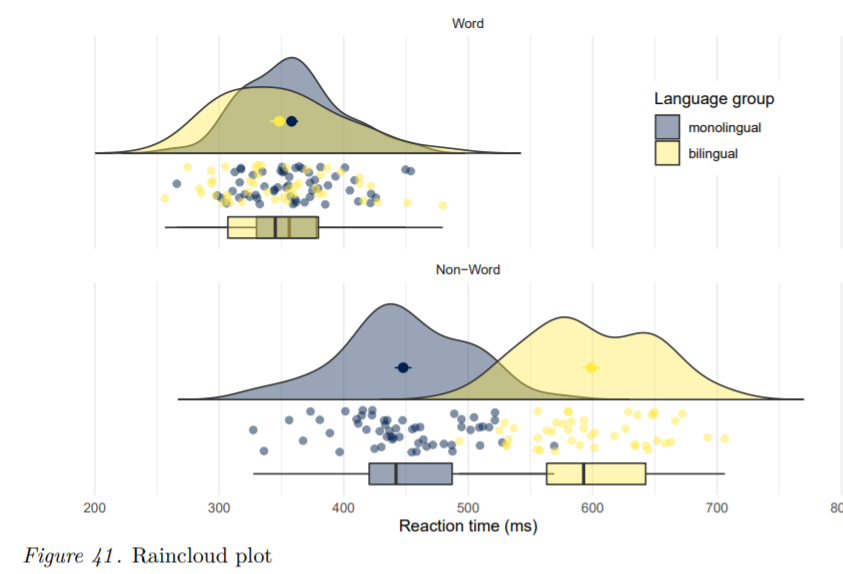
In addition to benefiting reproducibility and transparency, one of the advantages of using R is that researchers have a much larger range of fully customisable data visualisations options than are typically available in point and-click software, due to the open-source nature of R. These visualisation options not only look attractive, but can increase transparency about the distribution of the underlying data rather than relying on commonly used visualisations of aggregations such as bar charts of means. In this tutorial, we provide a practical introduction to data visualisation using R, specifically aimed at researchers who have little to no prior experience of using R. First we detail the rationale for using R for data visualisation and introduce the “grammar of graphics” that underlies data visualisation using the ggplot package. The tutorial then walks the reader through how to replicate plots that are commonly available in point-and-click software such as histograms and boxplots, as well as showing how the code for these “basic” plots can be easily extended to less commonly available options such as violin-boxplots. The dataset and code used in this tutorial as well as an interactive version with activity solutions, additional resources and advanced plotting options is available at https://osf.io/bj83f/. This is a pre-submission manuscript and tutorial and has not yet undergone peer review. We welcome user feedback which you can provide using this form: https://forms.office.com/r/ba1UvyykYR. Please note that this tutorial is likely to undergo changes before it is accepted for publication and we would encourage you to check for updates before citing.

Nordmann, Emily, Phil McAleer, Wilhelmiina Toivo, Helena Paterson, and Lisa M. DeBruine. 2021. “Data Visualisation Using R, for Researchers Who Don’t Use R.” PsyArXiv. June 21. doi:10.31234/osf.io/4huvw.

Additional materials: https://osf.io/bj83f/wiki/home/

Author(s): Emily Nordmann, Phil McAleer, Wilhelmiina Toivo, Helena Paterson, Lisa M. DeBruine

Publication Date: 21 June 2021

Publication Site: PsyArXiv