Graphic:
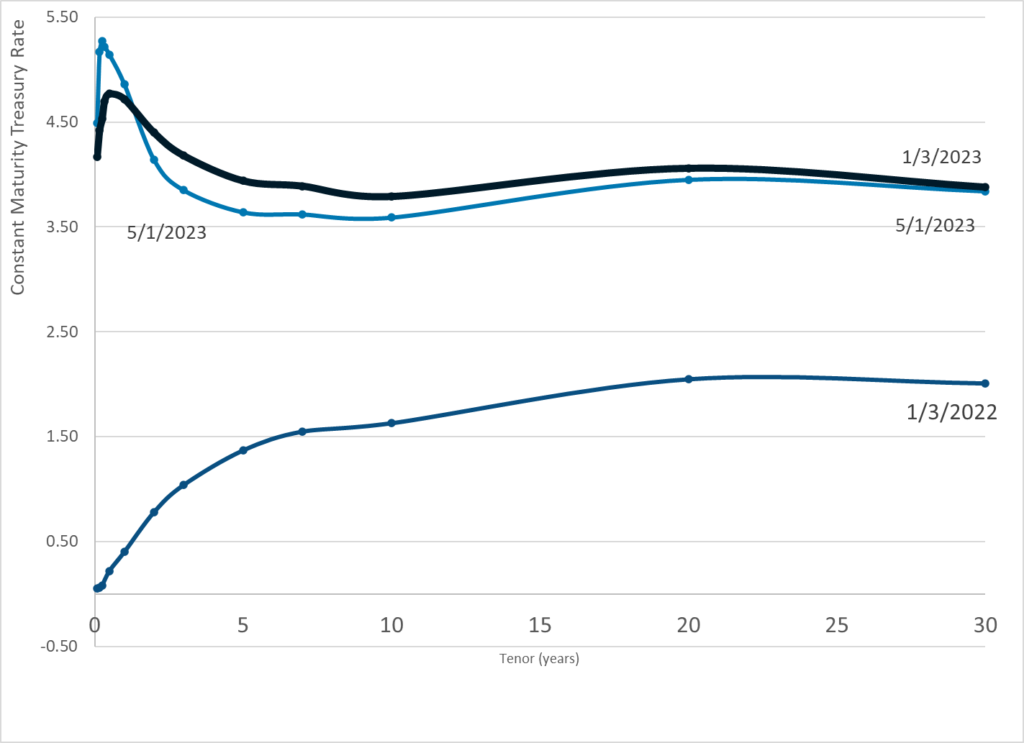
Publication Date: 5 May 2023
Publication Site: Treasury Department
All about risk
Graphic:
Publication Date: 5 May 2023
Publication Site: Treasury Department
Link: https://rajivsethi.substack.com/p/the-new-mortgage-fee-structure
Graphic:
Excerpt:
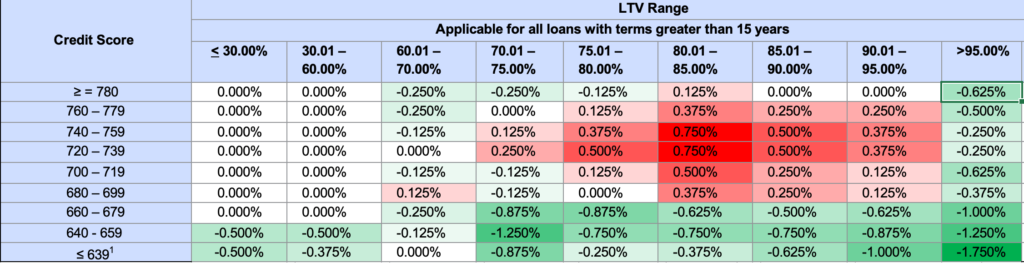
Notice that credit scores below 639 have been consolidated into a single row, and those above 740 have been split into three. In addition, loan-to-value ratios at 60% and below are now in two separate columns rather than one. This makes direct visual comparisons a little difficult, but one thing is clear—at no level of the loan-to-value ratio does someone with a lower credit score pay less than someone with a higher score. That is, one cannot gain by sabotaging one’s own credit rating.
In general, there are two types of borrowers who stand to gain under the new fee structure: those with low credit scores, and those with low down payments. In fact, those at the top of the credit score distribution gain under the new structure if they have down payments less than 5% of the value of the home. The following table shows gains and losses relative to the old structure, with reduced fees in green and elevated ones in red (a comparable color-coded chart with somewhat different cells may be found here):
What might the rationale be for rewarding those making especially low down payments? Perhaps the goal is to make housing more affordable for people without substantial accumulated savings or inherited wealth. But there will be an unintended consequence as those with reasonably high credit scores and substantial wealth choose to lower their down payments strategically in order to benefit from lower fees. They may do so by simply borrowing more for any given property, or buying more expensive properties relative to their accumulated savings. The incentive to do so will be strongest for those hit hardest by the changes, with credit scores in the 720-760 range and down payments between 15% and 20%.
Author(s): Rajiv Sethi
Publication Date: 23 Apr 2023
Publication Site: Imperfect Information at Substack
Link: https://angrybearblog.com/2023/04/income-tax-withholding-payments-stumble-again
Graphic:
Excerpt:
The important data this week will include new home sales tomorrow, Q1 GDP and initial jobless claims on Thursday, and most importantly of all (imo) real personal income and spending, along with real manufacturing and trade sales on Friday.
In the meantime, today let me take another look at a significant coincident indicator, income tax withholding payments, because the situation has changed in the past week.
….
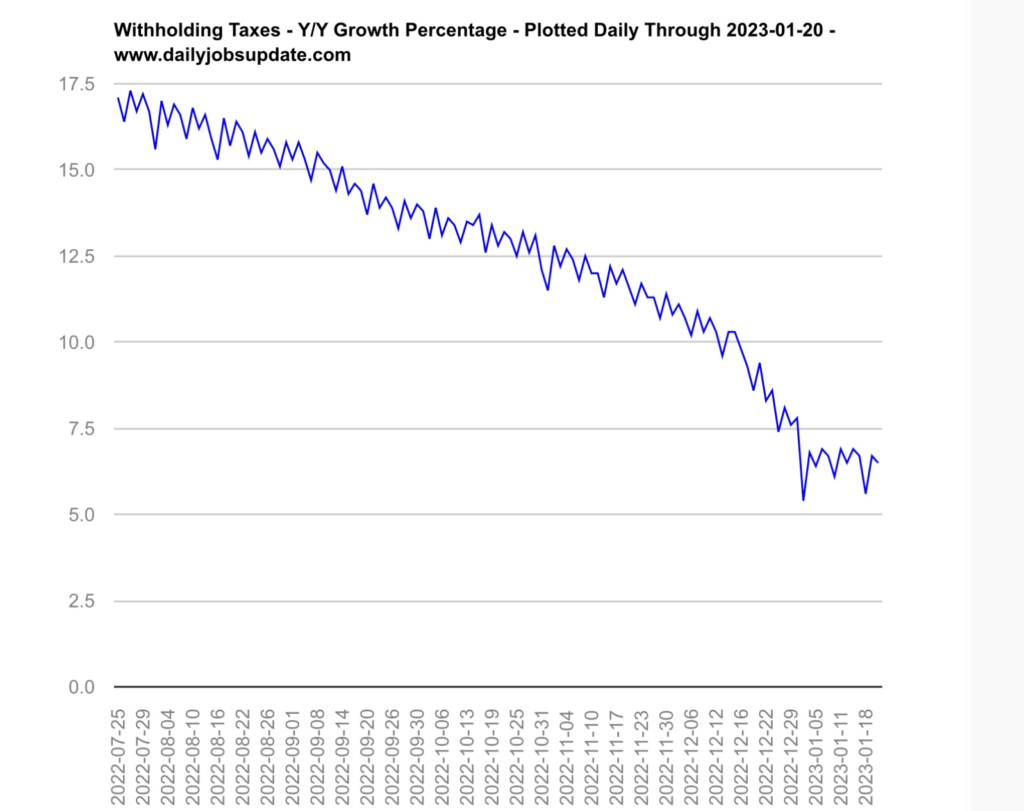
For the nation as a whole Matt Trivisonno has the YoY data, measuring the entire 365 day total of tax withholding vs. the entire previous 365 days, and has a public graph with a 3 month delay. Here’s his latest:
Like the California graph, it shows a steep deceleration during 2022, which had been as high as +21% YoY in March, down to only about +6% by the end of December. Thereafter through January, the YoY data stabilizes.
Indeed, by my own calculations, for the first three months of fiscal 2023 ending December 31, withholding tax payments were only up +1.2% YoY. But for Q2 they rebounded sharply, up +5.4% YoY.
But in the last 10 days they have stumbled. For the first 14 withholding days in April, payments are down -3.4%, $189.7 Billion vs. $196.3 Billion one year ago. For the last 4 weeks as a whole, withholding payments are down -5.0%, $270.2 Billion vs. $284.5 Billion.
Author(s): New Deal democrat
Publication Date: 25 April 2023
Publication Site: Angry Bear
Graphic:
:
Publication Date: 3 May 2023
Publication Site: Treasury Dept
Graphic:
Excerpt:
Please use the sharing tools found via the share button at the top or side of articles. Copying articles to share with others is a breach of FT.comT&Cs and Copyright Policy. Email licensing@ft.com to buy additional rights. Subscribers may share up to 10 or 20 articles per month using the gift article service. More information can be found here.
https://www.ft.com/content/ad3a97fc-6394-471b-95b6-a46576808f4a?accessToken=zwAF-p9xpktIkdOtOpf8Y5RHG9OVtqRldoCPSg.MEUCIDgGL7wEhhf0DcMprg_1VYV0TDGsyWYpn56E-cBhCGWoAiEA_YjdblG4oKzNoagG66jcPOhEtvtht7Du5gnihbZVDfU&sharetype=gift&token=82960010-bfb1-44e4-a677-de6e47ba5545
Any predictions are by their nature uncertain, yet a longevity modelling firm has forecasted that both candidates are likely to live well beyond the end of the next presidency in 2029. According to Club Vita, actuarial data suggests both men could have more than another decade ahead of them.
The company, which offers analytical services to insurers, said its US model suggested Biden has a life expectancy of another 11 years, taking him to 91. Trump has 14 more years to look forward to, per the model, meaning he would die at 90.
The model’s inputs include affluence, marital status, and employment. These key demographics for both Biden and Trump put them in the same favourable categories for the main factors, including addresses in the top category for life expectancy: the analysts used Trump’s Palm Beach address and Biden’s Delaware home.
Erik Pickett, a New Jersey-based actuary for Club Vita, said a wide range of factors could prove its model wrong, from whether the candidates “are in significantly different health to the average of someone with the same characteristics” to the fact that presidents have “access to higher quality medical treatments” than the typical American.
Author(s): Ian Smith in London and David Crow in New York
Publication Date: 30 April 2023
Publication Site: FT.com
Graphic:
Publication Date: 1 May 2023
Publication Site: Treasury Department
Graphic:
Publication Date: 27 Apr 2023
Publication Site: Treasury Dept
Graphic:

Excerpt:
A new report from SmartAsset finds that Social Security benefits comprise 41.7% of a retiree’s total income of $50,780, on average. That percentage is even higher for retirees in some cities, where benefits can make up half of overall retirement income.
To find out where retirees rely most on Social Security, SmartAsset examined data for Social Security income as a percentage of overall retirement income in the 100 U.S. cities with the largest population of residents ages 65 and older.
Author(s): Michael S. Fischer
Publication Date: 26 Apr 2023
Publication Site: Think Advisor
Link: https://onlinelibrary.wiley.com/doi/full/10.1111/eci.13998
Graphic:
Excerpt:
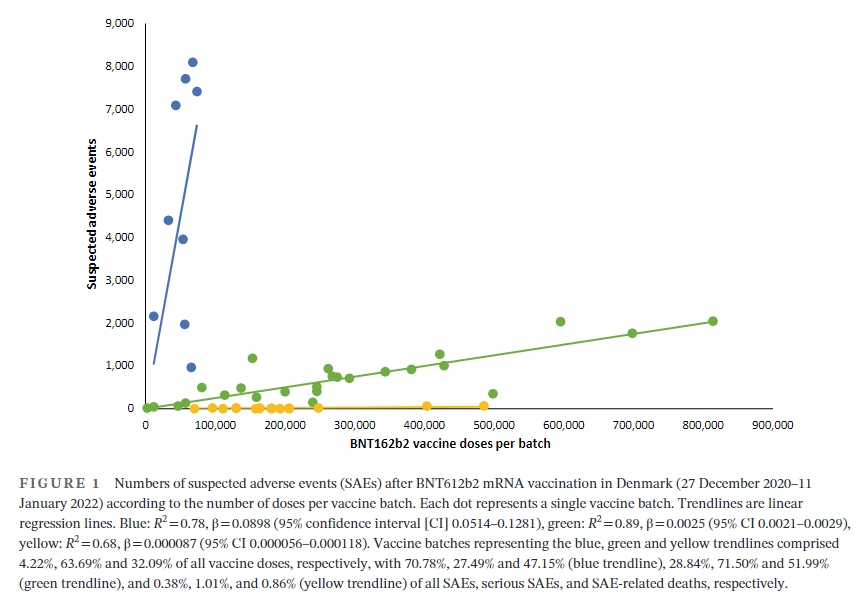
Vaccination has been widely implemented for mitigation of coronavirus disease-2019 (Covid-19), and by 11 November 2022, 701 million doses of the BNT162b2 mRNA vaccine (Pfizer-BioNTech) had been administered and linked with 971,021 reports of suspected adverse effects (SAEs) in the European Union/European Economic Area (EU/EEA).1 Vaccine vials with individual doses are supplied in batches with stringent quality control to ensure batch and dose uniformity.2 Clinical data on individual vaccine batch levels have not been reported and batch-dependent variation in the clinical efficacy and safety of authorized vaccines would appear to be highly unlikely. However, not least in view of the emergency use market authorization and rapid implementation of large-scale vaccination programs, the possibility of batch-dependent variation appears worthy of investigation. We therefore examined rates of SAEs between different BNT162b2 vaccine batches administered in Denmark (population 5.8 million) from 27 December 2020 to 11 January 2022.
….
A total of 7,835,280 doses were administered to 3,748,215 persons with the use of 52 different BNT162b2 vaccine batches (2340–814,320 doses per batch) and 43,496 SAEs were registered in 13,635 persons, equaling 3.19 ± 0.03 (mean ± SEM) SAEs per person. In each person, individual SAEs were associated with vaccine doses from 1.531 ± 0.004 batches resulting in a total of 66,587 SAEs distributed between the 52 batches. Batch labels were incompletely registered or missing for 7.11% of SAEs, leaving 61,847 batch-identifiable SAEs for further analysis of which 14,509 (23.5%) were classified as severe SAEs and 579 (0.9%) were SAE-related deaths. Unexpectedly, rates of SAEs per 1000 doses varied considerably between vaccine batches with 2.32 (0.09–3.59) (median [interquartile range]) SAEs per 1000 doses, and significant heterogeneity (p < .0001) was observed in the relationship between numbers of SAEs per 1000 doses and numbers of doses in the individual batches. Three predominant trendlines were discerned, with noticeable lower SAE rates in larger vaccine batches and additional batch-dependent heterogeneity in the distribution of SAE seriousness between the batches representing the three trendlines (Figure 1). Compared to the rates of all SAEs, serious SAEs and SAE-related deaths per 1.000 doses were much less frequent and numbers of these SAEs per 1000 doses displayed considerably greater variability between batches, with lesser separation between the three trendlines (not shown).
Author(s): Max Schmeling, Vibeke Manniche, Peter Riis Hansen
Publication Date: 30 Mar 2023
Publication Site: European Journal of Clinical Investigation
Graphic:
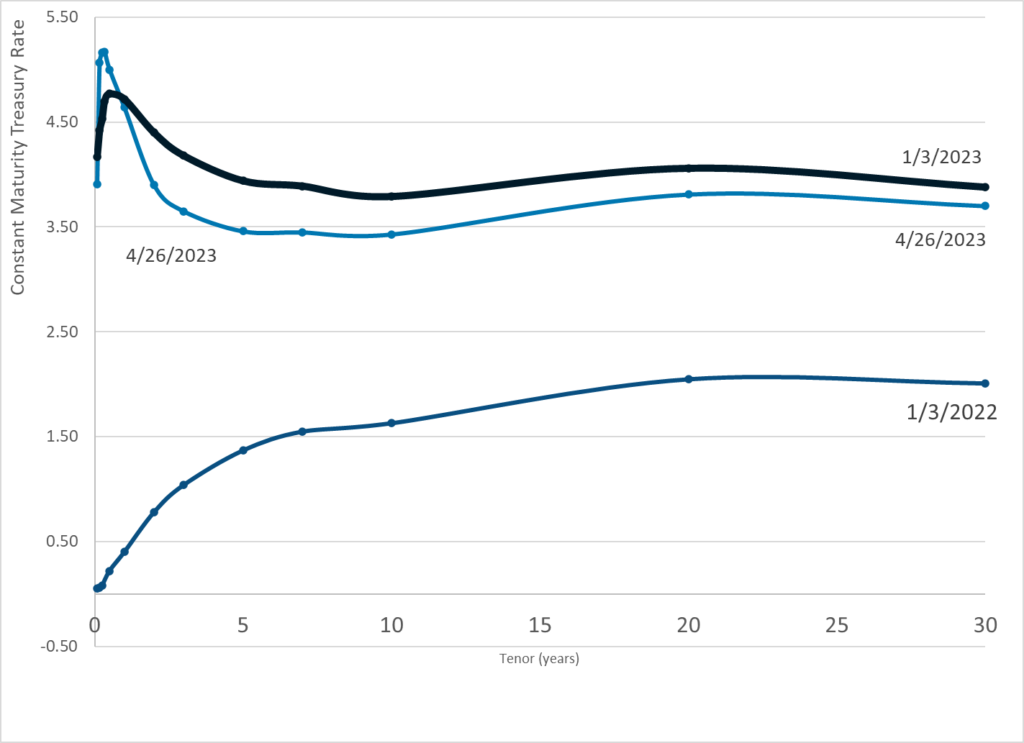
Publication Date: 26 Apr 2023
Publication Site: Treasury Department
Graphic:
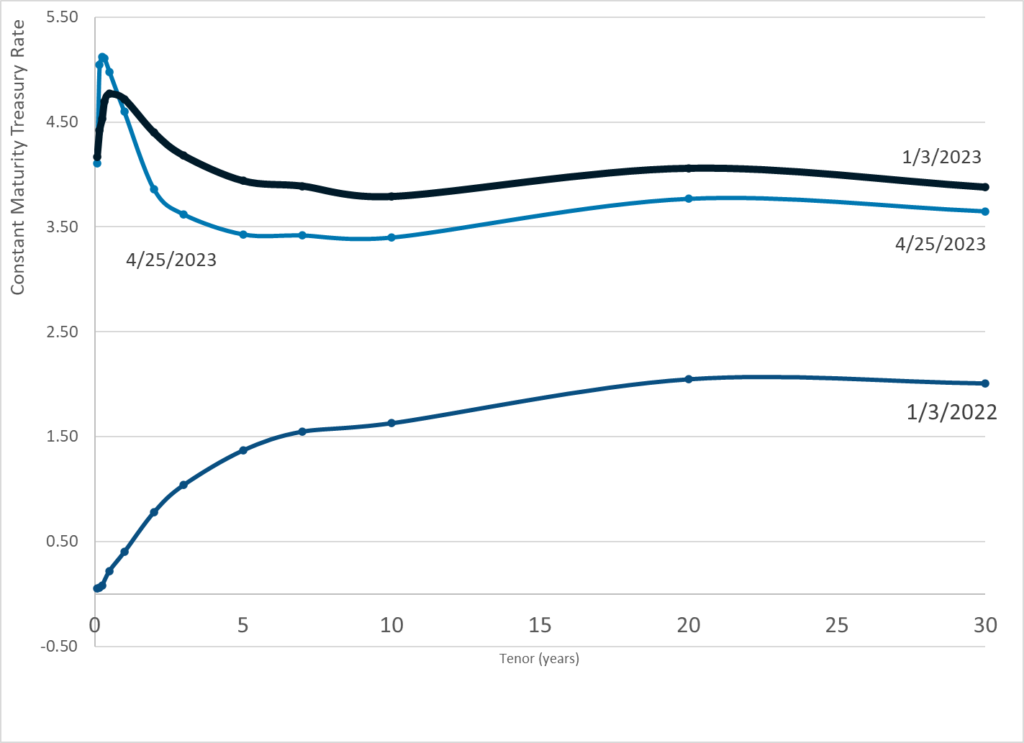
Publication Date: 25 Apr 2023
Publication Site: Treasury Dept
Link: https://finance.yahoo.com/news/debt-ceiling-fears-push-cost-184617316.html
Excerpt:
The cost of insurance against the US failing to repay its debts rose to its highest level since the financial crisis last week, as traders worried that political deadlock in Washington might lead to a default.
One-year government credit default swaps traded at 106 basis points Saturday – the most expensive they’ve been since 2008, according to a Financial Times report that cited Bloomberg data.
Credit default swaps – or CDSs – are a form of insurance against a borrower not making scheduled payments on their debt.
The price of one-year government CDSs has spiked 15 basis points in 2023 with traders spooked by the looming threat of a debt-ceiling crisis, the FT reported.
The debt ceiling is a limit on how much the government can borrow, set by Congress. The US hit its $31.4 trillion debt limit in January – and that means it could run out of money to pay its bills as soon as July if lawmakers don’t vote to raise the ceiling, according to the Congressional Budget Office.
Author(s): George Glover
Publication Date: 24 Apr 2023
Publication Site: Yahoo Finance