Wharton professor Jeremy Siegel says Jerome Powell is making one of the biggest policy mistakes in the Fed’s 110-year history, and it could lead to a major recession

Link: https://finance.yahoo.com/news/wharton-professor-jeremy-siegel-says-191800487.html

Excerpt:

The Wharton professor Jeremy Siegel has a big issue with the Federal Reserve’s aggressive interest-rate hikes in its bid to tame inflation, and he’s worried that the central bank is making the biggest mistake in its history and may provoke a steep recession.

Siegel said inflation is starting to come down significantly, but the Fed is still moving forward with its rate hikes.

He said it could be “one of the biggest policy mistakes in the 110-year history of the Fed, by staying so easy when everything was booming.”

…..

“I think the Fed is just way too tight. They’re making exactly the same mistake on the other side that they made a year ago,” Siegel added.

To Siegel’s point, the Fed has had a lousy record of accurately forecasting where it expects interest rates to be just a few months into the future.

….

“I am very upset. It’s like a pendulum. They were way too easy through 2020 and 2021, and now ‘we’re going to be real tough guys until we crush the economy,'” Siegel said of the Fed.

Siegel expects the Fed to “eventually see the light” as none of their recent predictions are likely to come true.

“I think they’re going to be forced to lower the rates much more rapidly than they think,” Siegel said, a move that could set up stocks for a potential recovery from their ongoing decline.

Author(s): Matthew Fox

Publication Date: 25 Sept 2022

Publication Site: Yahoo Finance
Reasons to Visualise the Same Data, Differently

Link: https://nightingaledvs.com/reasons-to-visualise-the-same-data-differently/

Graphic:

Excerpt:

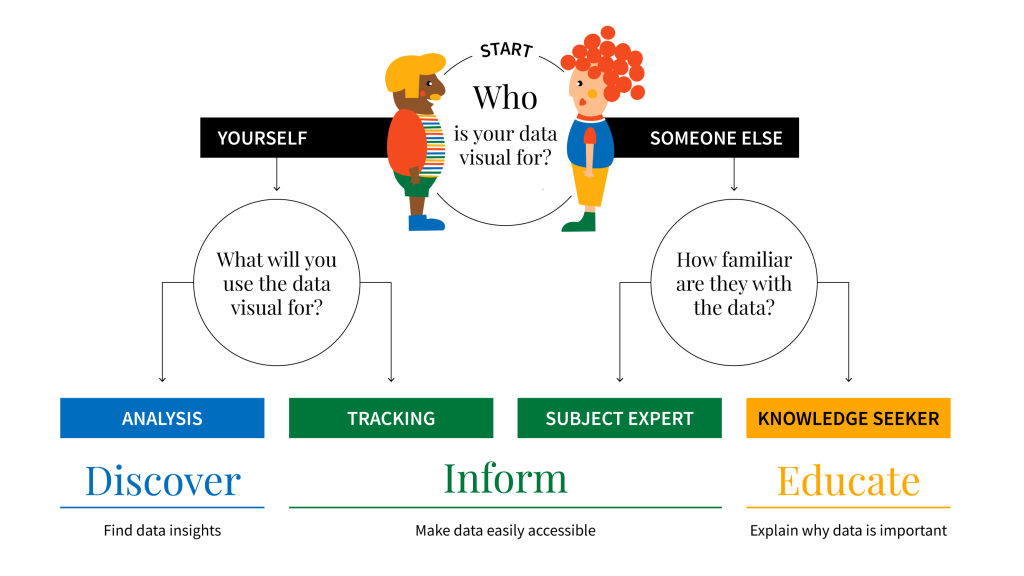
To quote Andy Kirk, “we can look at data, but we cannot really see it. To see data, we need to represent it in a different, visual form.” So, in an attempt to make data more accessible, you may create more visual representations – dots, lines, shapes, and colours. These building blocks combine to create all sorts of charts and pictures helping readers understand numbers. 

Although the purpose of visualising data is clear (and universal), the reasons can be different. The reason you visualise data, will help you determine the appropriate visual.

Author(s): Kat Greenbrook

Publication Date: 8 Sept 2022

Publication Site: Nightingale

A Workplan to Identify & Remove Unnecessary Barriers to Producer Licensure

Link: https://www.acli.com/-/media/acli/public/files/news-release-pdfs/workplan_barrierstoproducerlicensure09192022_final.pdf

Graphic:

Excerpt:

There have been recent efforts by the NAIC to report on the steps exam vendors have taken to mitigate
cultural bias in producer licensing exams; however, based on state-level data, this issue deserves closer
attention.


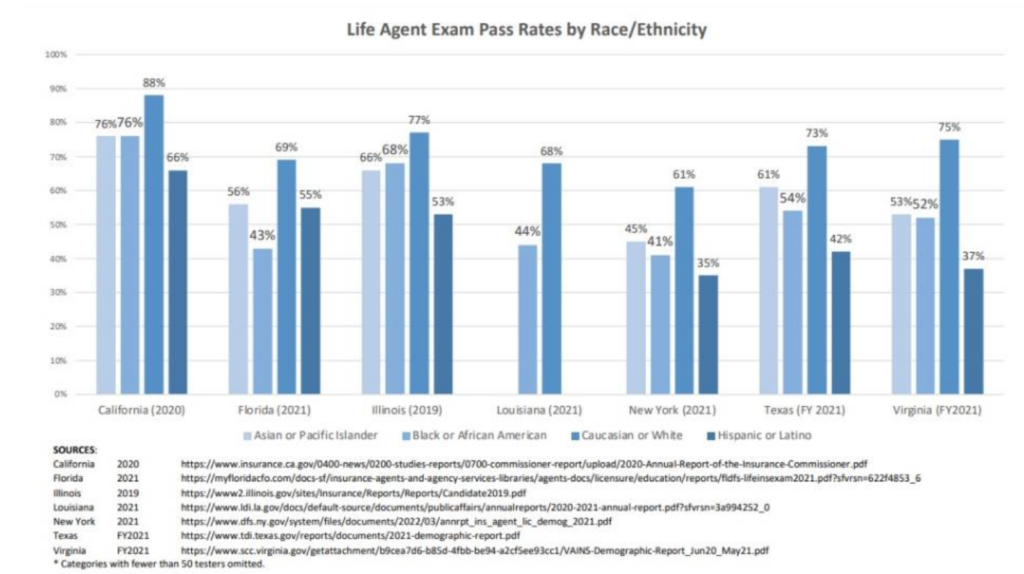
There are only seven states that annually prepare and publish licensing exam pass rates by
demographic, including race/ethnicity. For more than a decade, these reports have routinely shown
Caucasian/white candidates scoring higher than other demographic groups across nearly all lines.


When comparing Life Insurance Exam Pass Rates by Race/Ethnicity, an alarming trend appears. It’s clear
that non-Caucasians or non-white demographics are not efficiently making it through the licensing
process. This clearly suggests licensing exams warrant more scrutiny, particularly to ensure these tests
are not screening diversity from the industry.

Author(s): ACLI, NAIFA, Finseca

Publication Date: Sept 2022

Publication Site: ACLI

Life Groups Calls on States to Review Agent Exam Difficulty

Link: https://www.thinkadvisor.com/2022/09/22/life-groups-calls-on-states-to-review-agent-exam-difficulty/

Excerpt:

The American Council of Life Insurers has joined with two rival producer groups, the National Association of Insurance and Financial Advisors and Finseca, to send state lawmakers, insurance commissioners and other policymakers a new 10-page position paper, “A Workplan to Identify & Remove Unnecessary Barriers to Producer Licensure.”

The groups contend that better licensing rules would expand the supply of agents, brokers and other insurance producers, as well as increase producer diversity.

Author(s): Allison Bell

Publication Date: 22 Sept 2022

Publication Site: Think Advisor

An Actuarial View of Correlation and Causation—From Interpretation to Practice to Implications

Link: https://www.actuary.org/sites/default/files/2022-07/Correlation.IB_.6.22_final.pdf

Graphic:

Excerpt:

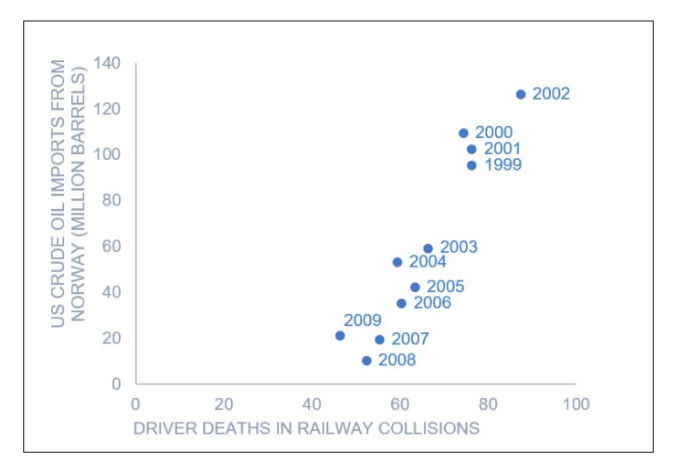
Examine the quality of the theory behind the correlated variables. Is there good
reason to believe, as validated by research, the variables would occur together? If such
validation does not exist, then the relationship may be spurious. For example, is there
any validation to the relationship between the number of driver deaths in railway
collisions by year (the horizontal axis), and the annual imports of Norwegian crude
oil by the U.S., as depicted below?36 This is an example of a spurious correlation. It is
not clear what a rational explanation would be for this relationship.

Author(s): Data Science and Analytics Committee

Publication Date: July 2022

Publication Site: American Academy of Actuaries

John Hancock to Pilot 50-Cancer Detection Test

Link: https://www.thinkadvisor.com/2022/09/20/john-hancock-to-pilot-50-cancer-detection-test/

Excerpt:

John Hancock wants to find out what happens when life insurance insureds get a blood test that might reveal early signs of about 50 different types of cancer.

The Boston-based Manulife subsidiary is working with Munich Re and other reinsurers to offer a pilot program that will pay either 50% or 100% of the cost of Grail’s Galleri cancer screening test for insureds in the John Hancock Vitality wellness program.

John Hancock will not get individual test results for the insureds who use the pilot program, nor will the program results affect the participants’ coverage, premiums or Vitality points.

Author(s): Allison Bell

Publication Date: 20 Sept 2022

Publication Site: Think Advisor

Late-in-Life Decisions Guide

Link: https://www.soa.org/resources/research-reports/2022/2022-lil-decisions-guide/

report: https://www.soa.org/497f1c/globalassets/assets/files/resources/research-report/2022/lil-decisions-guide.pdf

Graphic:

Excerpt:

Much of retirement planning focuses on financial, investment, and estate planning needs. Earlier research,
such as the SOA’s Retirement Health & Happiness brief, showcases how this retirement planning overlooks some challenges of late-in-life retirees.


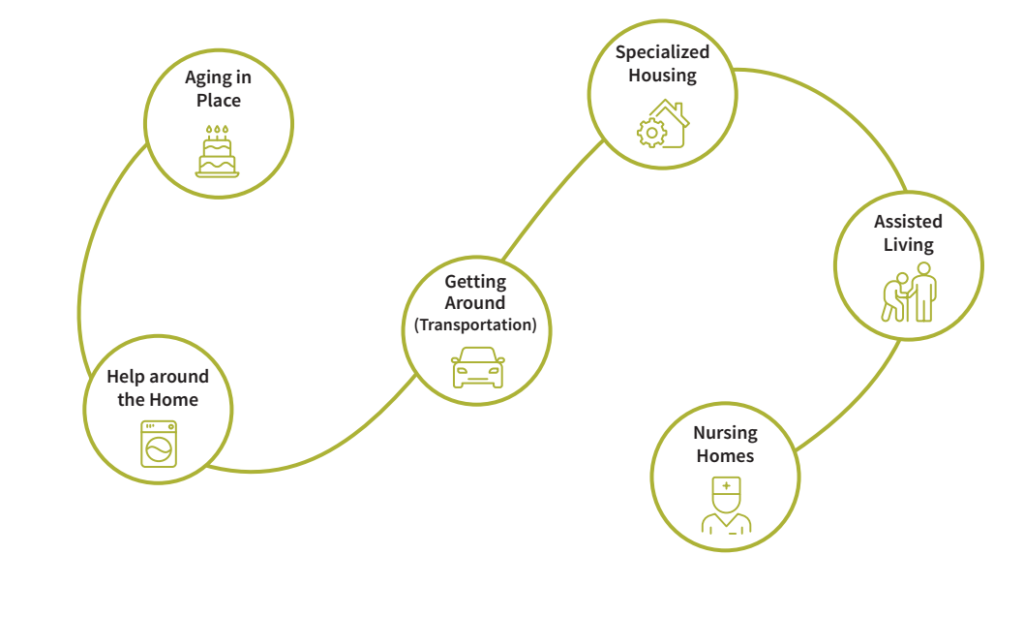
Retirees have access to more than 200,000 personal finance professionals, 10,000 senior centers, and
approximately 28,000 assisted living facilities. Still, do retirees have all the information they need to make
critical decisions throughout retirement, particularly in the latter stages of retirement?

In collaboration with Financial Finesse, the SOA Aging and Retirement Strategic Research Program
prepared this guide as a resource to help older retirees and those who assist them. This guide will
help the reader ask impactful questions to make informed decisions.

Author(s): SOA Aging and Retirement Strategic Research Program

Publication Date: 2022

Publication Site: Society of Actuaries

Measuring Public Pension Health

Link: https://www.ncpers.org/files/ncpers-pension-metrics-2022.pdf

Webinar slides: https://www.nirsonline.org/wp-content/uploads/2022/03/FINAL-Pension-Health-Webinar-September-2022.pdf

Webinar video:

Graphic:

Excerpt:

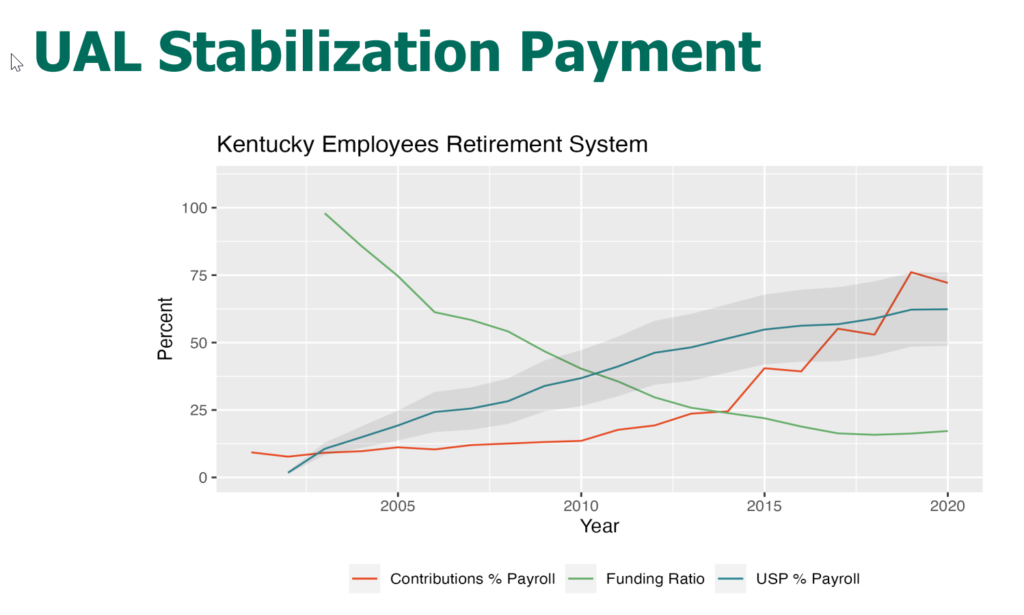
This report describes a “scorecard”, a standardized summary of pension valuation results (shown on next page), as well as three new metrics, of varying degrees of novelty, to appear on it:


 The Scaled Liability is a measurement of pension liabilities against the size of the economy that supports these liabilities.
 The UAL Stabilization Payment (USP) is an objectively defined cash flow policy standard comparable to
the funding ratio, an objectively defined balance sheet policy standard.
 Risk-Weighting Assets is a proposed method to assess the value of a plan’s assets, taking into account
its capacity to endure the downside risk it has taken on through its allocation of investments.


Author(s): Tom Sgouros

Publication Date: September 2022

Publication Site: NCPERS

BIG DATA AND ALGORITHMS IN ACTUARIAL MODELING AND CONSUMER IMPACTS

Link: https://www.actuary.org/sites/default/files/2022-08/IABAAug2022_Sandberg_Presentation.pdf

Graphic:

Excerpt:

Systemic Influences and Socioeconomics
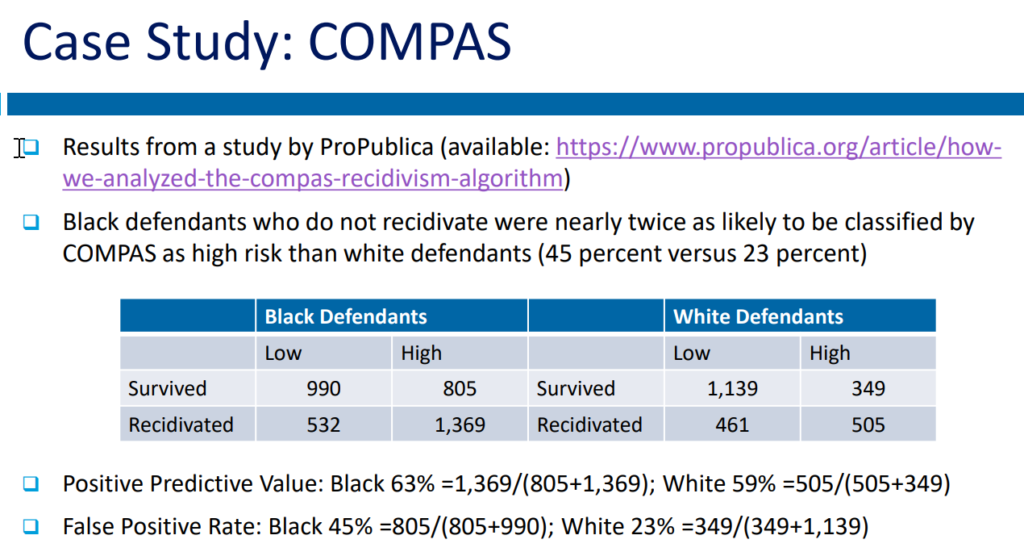
❑ Checking for and removing of systemic biases is difficult.
❑ Systemic biases can creep in at every step of the modeling process: data,
algorithms, and validation of results.
❑ Human involvement in designing and coding algorithms, where there is a lack of diversity
among coders
❑ Biases embedded in training datasets
❑ Use of variables that proxy for membership in a protected class
❑ Statistical discrimination profiling shopping behavior, such as price optimization
❑ Technology-facilitated advertising algorithms used in ad targeting and ad delivery

Author(s): David Sandberg, Data Science and Analytics Committee, AAA

Publication Date: August 2022

Publication Site: American Academy of Actuaries

Senate Finance Chair Broadens Inquiry Into Private Placement Life Insurance

Link: https://www.thinkadvisor.com/2022/09/21/senate-finance-chair-broadens-inquiry-into-private-placement-life-insurance/

Graphic:

Excerpt:

A lawmaker who helps shape federal tax legislation has indicated that he wants to keep wealthy families from using private placement life insurance to replace any federal tax loopholes that Congress closes.

Sen. Ron Wyden, D-Ore., the chair of the Senate Finance Committee, today announced that he has written to Prudential Financial, Zurich Insurance Group and the American Council of Life Insurers to get more information about the PPLI market, and the possibility that many PPLI policies may serve only to reduce the income taxes of families that rank in the wealthiest 1% of American families, not to provide genuine insurance.

“Is investment in PPLI products marketed to new or existing clients as a means to minimize or eliminate ordinary income, capital gains or estate taxes?” Wyden asks in the letters to Prudential and Zurich. “If so, please explain the legal basis for why these products help minimize or eliminate taxes.”

Author(s): Allison Bell

Publication Date: 21 Sept 2022

Publication Site: Think Advisor

Pa. pension fund down over $3 billion in tough market, and braces for losses ahead

Link: https://www.inquirer.com/business/sers-pension-drop-investments-retirement-20220923.html

Graphic:

Excerpt:

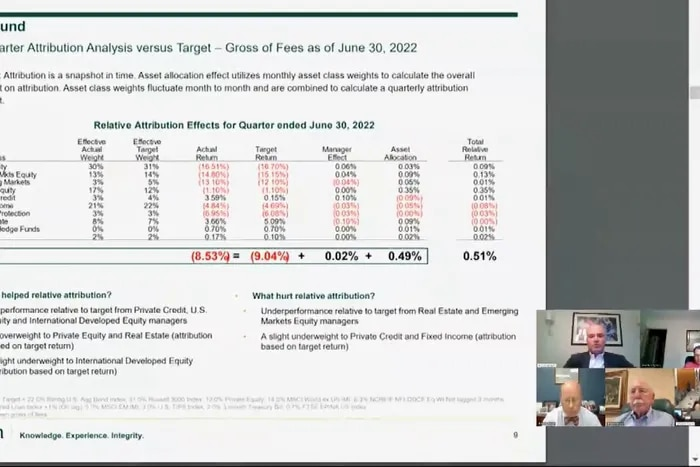
The drop in global stock and bond values has shaved about $3 billion off the Pennsylvania State Employees’ Retirement System (SERS) during the second quarter, staff and consultants warned trustees in Thursday’s investment meeting.

The fund was worth $34.5 billion at midyear, down from $38 billion three months before, after counting an 8.5% investment loss for the quarter, along with payouts to 130,000 pensioners, and ongoing contributions from taxpayers and 100,000 state workers — lawmakers, judges, college staff, corrections officers, troopers, social workers — who hope to retire someday with pensions from the system.

The fund posted the decline as legislators have been weighing how to cope with pressure to boost pensions for more than 70,000 older state and public school retirees, whose last “cost of living allowance” increases took effect in 2004. Their pension checks, unchanged since that time, are losing pricing power after food, fuel, and other prices rose earlier this year at the fastest rate since the early 1980s.

Author(s): Joseph DiStefano

Publication Date: 23 Sept 2022

Publication Site: Philadelphia Enquirer

New Report Measures Public Pension Health

Link: https://www.ai-cio.com/news/new-report-measures-public-pension-health/

Excerpt:

The National Conference on Public Employee Retirement Systems recently released a report entitled “Measuring Public Pension Health: New Metrics, New Approaches” that introduces new mechanisms to account and judge the sustainability of pension plans.

To create these, the report’s author, Tom Sgouros, fellow and co-chair at The Policy Lab at Brown University, formed and hosted the Pension Accounting Working Group, a group made up of actuaries and public pension experts. The group assembled to measure the health of plans, and create new metrics to generate greater insights into a pension’s sustainability, so that trustees and policymakers could make better and more informed decisions.

The working group came up with three new metrics. The first is “scaled liability,” a measurement of pension liabilities against the size of the underlying supporting economy. The second is “unfunded actuarial liability (UAL) stabilization payment,” an objectively defined cash-flow policy standard comparable to the funding ratio. And last is “risk-weighting asset values,” a method to assess the value of a plan’s assets that accounts for a plan’s capacity to endure the downside risk it has taken through the allocation of its assets.

The scaled liability measurement uses economic strength as a proxy for tax capacity. This measurement helps decisionmakers get a read on a plan’s sustainability by providing a comparison between a pension plan and the economic strength of its sponsor. The Federal Reserve includes a comparison of net pension liability with measures of GDP and state revenues in the “Enhanced Financial Accounts” component of its “Financial Accounts of the United States” report.

Author(s): Dusty Hagedorn

Publication Date: 23 Sept 2022

Publication Site: ai-CIO