Link: https://nightingaledvs.com/reasons-to-visualise-the-same-data-differently/
Graphic:
Excerpt:
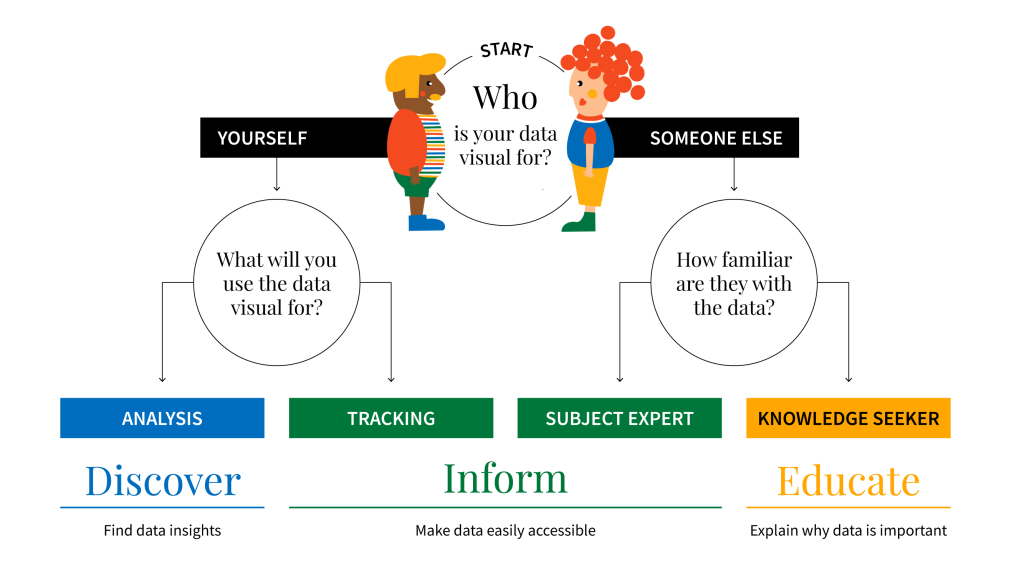
To quote Andy Kirk, “we can look at data, but we cannot really see it. To see data, we need to represent it in a different, visual form.” So, in an attempt to make data more accessible, you may create more visual representations – dots, lines, shapes, and colours. These building blocks combine to create all sorts of charts and pictures helping readers understand numbers.
Although the purpose of visualising data is clear (and universal), the reasons can be different. The reason you visualise data, will help you determine the appropriate visual.
Author(s): Kat Greenbrook
Publication Date: 8 Sept 2022
Publication Site: Nightingale