Individual Disability Carriers Steer Through Uncertain Times

Link: https://www.genre.com/knowledge/blog/2022/august/individual-disability-carriers-steer-through-uncertain-times-en

Graphic:

Excerpt:

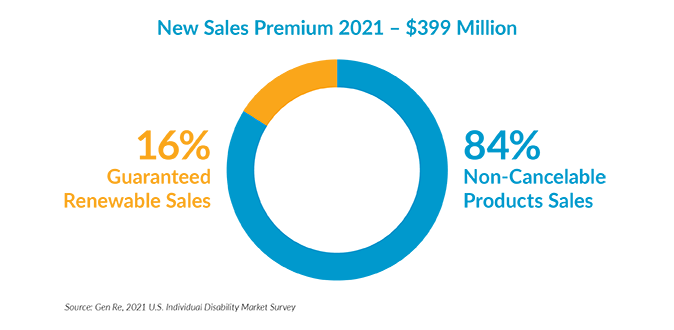
Seventeen carriers participated in our 2021 U.S. Individual Disability Market Survey, representing 99% of the market and $5.1 billion of in‑force premium. New sales in 2021 were $399 million which was flat when compared to new sales in 2020. Breaking this down even further, both Non-Cancelable (Non‑Can) and Guaranteed Renewable (GR) sales were flat when compared to 2020. Non‑Can was down 0.1% and GR was up 0.5%. Of the $399 million in total new sales premium, Non‑Can products represent 84% or $334 million, and GR is 16% or $65 million.

When asked about meeting their 2021 sales goals, 47% of the responding companies said they missed theirs. 18% of the companies met and 35% of the companies exceeded their goals. Some of the reasons given for missing sales goals were:

COVID limited face-to-face contact with consumers

Agents were focused on other products such as life insurance

The number of new policies issued grew by 2% to over 251,000 and total benefit amounts increased by 3% to more than $1.6 billion. The medical market continues to be a main driver of new business. In 2021, close to 30% of all new policies sold were in the medical market; however, the industry did see some growth down-market with increases in the number of new policies sold in the blue collar space.

Author(s): Steve Woods

Publication Date: 3 Aug 2022

Publication Site: Gen Re Perspective

Business Cycle Dating Procedure: Frequently Asked Questions

Link: https://www.nber.org/business-cycle-dating-procedure-frequently-asked-questions

Excerpt:

Q: The financial press often states the definition of a recession as two consecutive quarters of decline in real GDP. How does that relate to the NBER’s recession dates?

A: Most of the recessions identified by our procedures do consist of two or more consecutive quarters of declining real GDP, but not all of them. In 2001, for example, the recession did not include two consecutive quarters of decline in real GDP. In the recession from the peak in December 2007 to the trough in June 2009, real GDP declined in the first, third, and fourth quarters of 2008 and in the first and second quarters of 2009. Real GDI declined for the final three quarters of 2001 and for five of the six quarters in the 2007–2009 recession.

Q: Why doesn’t the committee accept the two-quarter definition?

A: There are several reasons. First, we do not identify economic activity solely with real GDP, but consider a range of indicators. Second, we consider the depth of the decline in economic activity. The NBER definition includes the phrase, “a significant decline in economic activity.” Thus real GDP could decline by relatively small amounts in two consecutive quarters without warranting the determination that a peak had occurred. Third, our main focus is on the monthly chronology, which requires consideration of monthly indicators. Fourth, in examining the behavior of production on a quarterly basis, where real GDP data are available, we give equal weight to real GDI. The difference between GDP and GDI—called the “statistical discrepancy”—was particularly important in the recessions of 2001 and 2007–2009.

Author(s):

Publication Date: 19 July 2021 last updated, accessed 3 August 2022

Publication Site: NBER

Examining the Teachers Retirement System of Texas after the pension reforms of 2019

Link: https://reason.org/backgrounder/reason-review-trs-after-sb12/

Graphic:

Excerpt:

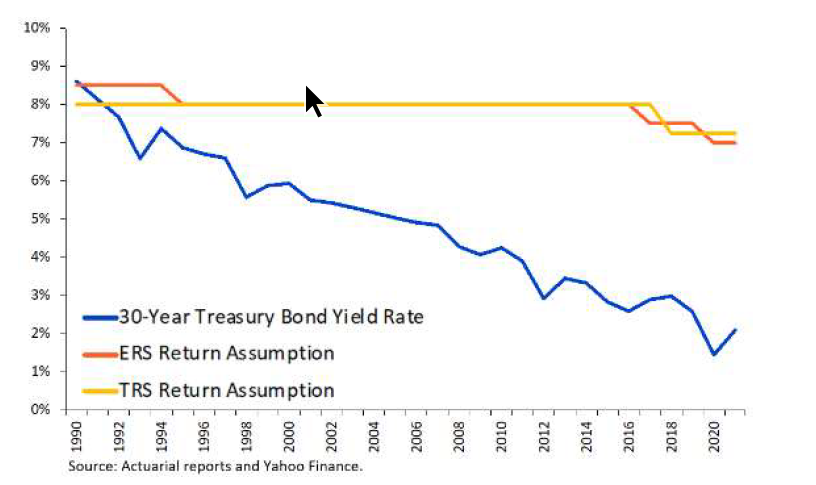
TRS currently uses a 7.25% assumed rate of return, which is on the higher end of investment return assumptions among major public systems.

The national average expected rate of return has fallen to 7.0% over the years, with major plans like CalPERS now lowering assumptions into the 6-7% range.

Despite SB12 (2019), with investment returns expected to underperform over the next decade relative to expectations, capping contribution rates in statute creates the perfect conditions for unfunded liabilities to keep accruing just as they have since 2001.

Author(s): Leonard Gilroy, Steven Gassenberger

Publication Date: 3 June 2022

Publication Site: Reason

What can go wrong? Exploring racial equity dataviz and deficit thinking, with Pieta Blakely.

Link: https://3iap.com/what-can-go-wrong-racial-equity-data-visualization-deficit-thinking-VV8acXLQQnWvvg4NLP9LTA/

Graphic:

Excerpt:

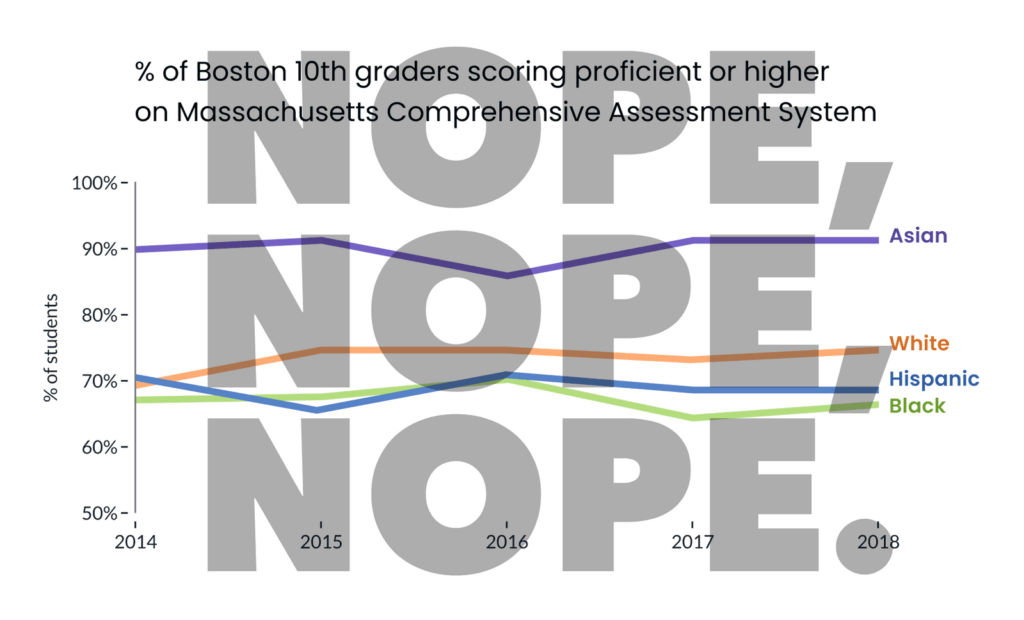
For anti-racist dataviz, our most effective tool is context. The way that data is framed can make a very real impact on how it’s interpreted. For example, this case study from the New York Times shows two different framings of the same economic data and how, depending on where the author starts the X-Axis, it can tell 2 very different — but both accurate — stories about the subject.

As Pieta previously highlighted, dataviz in spaces that address race / ethnicity are sensitive to “deficit framing.” That is, when it’s presented in a way that over-emphasizes differences between groups (while hiding the diversity of outcomes within groups), it promotes deficit thinking (see below) and can reinforce stereotypes about the (often minoritized) groups in focus.

In a follow up study, Eli and Cindy Xiong (of UMass’ HCI-VIS Lab) confirmed Pieta’s arguments, showing that even “neutral” data visualizations of outcome disparities can lead to deficit thinking (and therefore stereotyping) and that the way visualizations are designed can significantly impact these harmful tendencies.

Author(s): Eli Holder, Pieta Blakely

Publication Date: 2 Aug 2022

Publication Site: 3iap

Report: CT’s pension debt remains high despite residents’ personal wealth

Link: https://ctmirror.org/2022/08/02/report-ct-pension-debt-personal-income-high-eighth-worst-us/

Graphic:

Excerpt:

When Connecticut deposits roughly $4.1 billion into its pension funds this fall, it will mark the third consecutive year the state used its budget surplus to whittle down the massive pension debt accrued over more than seven decades.

But a recent analysis from The Pew Charitable Trusts provided a sobering reminder of just how far Connecticut still has to go — even considering its great wealth — to overcome decades of fiscal irresponsibility.

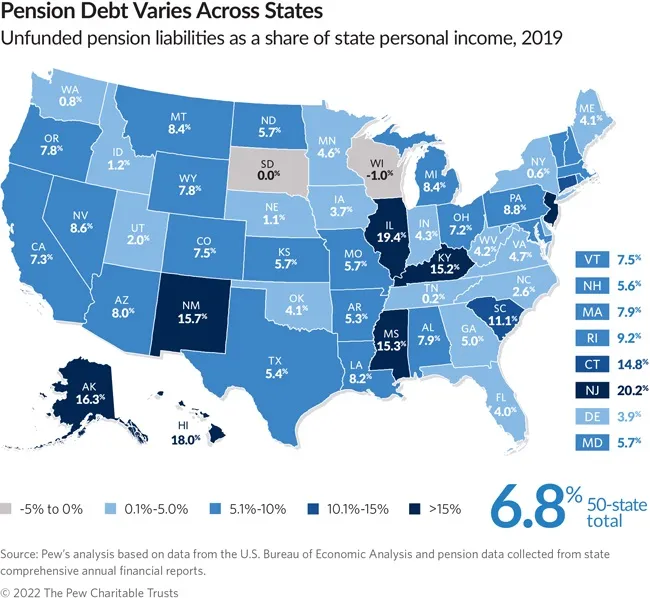
Connecticut had reported more than $41 billion in combined debt among its pensions for state employees and for teachers following the 2019 fiscal year. According to Pew, that represented 14.8% of Connecticut’s personal income at the time — more than double the national average of 6.8%.

Connecticut was one of just 10 states that topped the 10% mark, and ranked eighth-worst overall. New Jersey finished at the bottom with pension debt equal to 20.2% of statewide personal income.

Author(s): Keith Phaneuf

Publication Date: 2 Aug 2022

Publication Site: CT Mirror

“Dispersion & Disparity” Research Project Results

Link: https://3iap.com/dispersion-disparity-equity-centered-data-visualization-research-project-Wi-58RCVQNSz6ypjoIoqOQ/

Graphic:

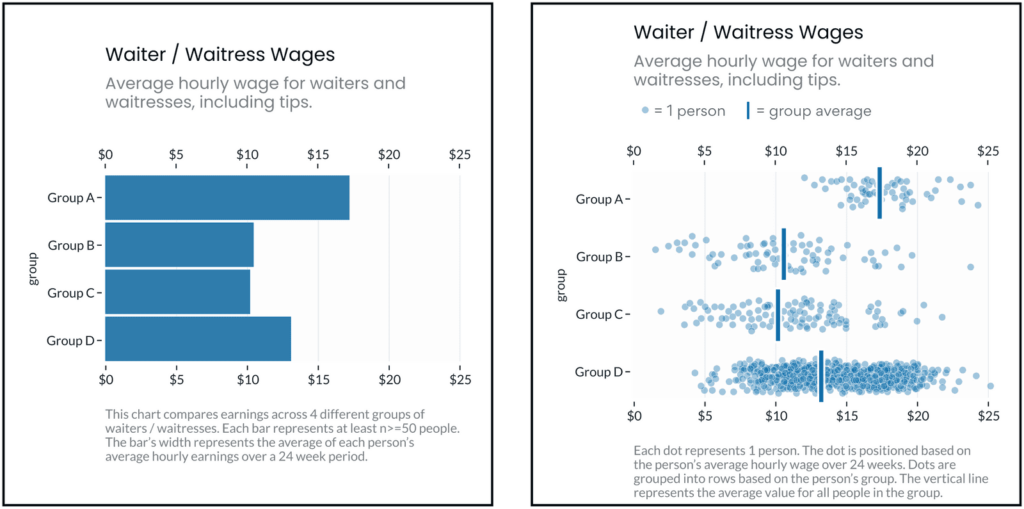
The same dataset, visualized two different ways. The left fixates on between-group differences, which can encourage stereotyping. The right shows both between and within group differences, which may discourage viewers’ tendencies to stereotype the groups being visualized.

Excerpt:

Ignoring or deemphasizing uncertainty in dataviz can create false impressions of group homogeneity (low outcome variance). If stereotypes stem from false impressions of group homogeneity, then the way visualizations represent uncertainty (or choose to ignore it) could exacerbate these false impressions of homogeneity and mislead viewers toward stereotyping.

If this is the case, then social-outcome-disparity visualizations that hide within-group variability (e.g. a bar chart without error bars) would elicit more harmful stereotyping than visualizations that emphasize within-group variance (e.g. a jitter plot).

Author(s): Stephanie Evergreen

Publication Date: 2 Aug 2022

Publication Site: 3iap

Pension Plunge Puts Eric Adams in Future Financial Squeeze

Link: https://www.thecity.nyc/2022/8/1/23287828/pension-plunge-eric-adams

Excerpt:

New York City’s pension funds lost 8.65% of their value for the fiscal year that ended June 30, according to a release Friday from city Comptroller Brad Lander. 

While more detailed information won’t be released until September, the losses reduced the pension funds to about $240 billion.

While the S&P 500 stock index fell 14% in the first six months of 2022, Lander said that all is well with the pension funds “Despite market declines on a scale that hasn’t been seen in decades, the New York City retirement system outperformed our benchmarks and are well positioned to weather market volatility in the long run,” he said in a statement.

But the city budget — currently $101 billion — will still take a hit.

Author(s): Greg David

Publication Date: 1 Aug 2022

Publication Site: The City

Coordinating VM-31 With ASOP No. 56 Modeling

Link: https://www.soa.org/sections/financial-reporting/financial-reporting-newsletter/2022/july/fr-2022-07-rudolph/

Excerpt:

In the PBRAR, VM-31 3.D.2.e.(iv) requires the actuary to discuss “which risks, if any, are not included in the model” and 3.D.2.e.(v) requires a discussion of “any limitations of the model that could materially impact the NPR [net premium reserve], DR [deterministic reserve] or SR [stochastic reserve].” ASOP No. 56 Section 3.2 states that, when expressing an opinion on or communicating results of the model, the actuary should understand: (a) important aspects of the model being used, including its basic operations, dependencies, and sensitivities; (b) known weaknesses in assumptions used as input and known weaknesses in methods or other known limitations of the model that have material implications; and (c) limitations of data or information, time constraints, or other practical considerations that could materially impact the model’s ability to meet its intended purpose.

Together, both VM-31 and ASOP No. 56 require the actuary (i.e., any actuary working with or responsible for the model and its output) to not only know and understand but communicate these limitations to stakeholders. An example of this may be reinsurance modeling. A common technique in modeling the many treaties of yearly renewable term (YRT) reinsurance of a given cohort of policies is to use a simplification, where YRT premium rates are blended according to a weighted average of net amounts at risk. That is to say, the treaties are not modeled seriatim but as an aggregate or blended treaty applicable to amounts in excess of retention. This approach assumes each third-party reinsurer is as solvent as the next. The actuary must ask, “Is there a risk that is ignored by the model because of the approach to modeling YRT reinsurance?” and “Does this simplification present a limitation that could materially impact the net premium reserve, deterministic reserve or stochastic reserve?”

Understanding limitations of a model requires understanding the end-to-end process that moves from data and assumptions to results and analysis. The extract-transform-load (ETL) process actually fits well with the ASOP No. 56 definition of a model, which is: “A model consists of three components: an information input component, which delivers data and assumptions to the model; a processing component, which transforms input into output; and a results component, which translates the output into useful business information.” Many actuaries work with models on a daily basis, yet it helps to revisit this important definition. Many would not recognize the routine step of accessing the policy level data necessary to create an in-force file as part of the model itself. The actuary should ask, “Are there risks introduced by the frontend or backend processing in the ETL routine?” and “What mitigations has the company established over time to address these risks?”

Author(s): Karen K. Rudolph

Publication Date: July 2022

Publication Site: SOA Financial Reporter
Job Switchers Are Earning a Lot More Than Those Who Stay

Link: https://www.wsj.com/articles/inflation-switch-jobs-more-money-fed-atlanta-data-11658699425

Graphic:

Excerpt:

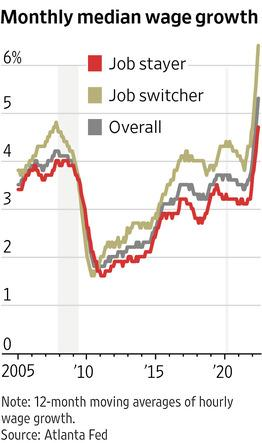
The pay difference between those who stay and those who changed jobs is growing, according to the Federal Reserve Bank of Atlanta. Job stayers, or people who stayed in their job for the past three months, increased their wages by about 4.7% as of June 2022. Meanwhile, those who switched jobs received a raise of 6.4%. The gap is the largest in two decades.

Workers are facing fast-rising prices on gas, groceries, rent and other essentials. Even in a tight labor market, many workers aren’t getting a large enough pay increase at their current job to keep up with inflation, say workers and economists who study the labor market. As a result, some Americans are reconsidering expenses they once considered affordable, while many also are looking for a new job with a bigger paycheck to keep up.

Prof. Yongseok Shin, an economics professor at Washington University in St. Louis, says inflation and the ability to get higher wages by changing companies are pushing many to move on. Some 47 million Americans have changed jobs in the past year, according to the Bureau of Labor Statistics. “I think the workers are paying a lot more attention,” said Prof. Shin. “They are comparing their wage growth with the headline inflation numbers.”

Author(s): Julia Carpenter

Publication Date: 25 Jul 2022

Publication Site: WSJ

CMI mortality monitor – week 28 of 2022

Link: https://www.actuaries.org.uk/system/files/field/document/Mortality%20summary%20pandemic%20monitor%20Week%2028%202022%20v01%202022-07-26.pdf

Graphic:

Excerpt:

Data sources
The provisional weekly deaths are available from:
• ONS (England & Wales)
https://www.ons.gov.uk/peoplepopulationandcommunity/birthsdeathsandmarriages/deaths/datasets/wee
klyprovisionalfiguresondeathsregisteredinenglandandwales
• NRS (Scotland)
https://www.nrscotland.gov.uk/covid19stats
• NISRA (Northern Ireland)
https://www.nisra.gov.uk/statistics/death-statistics/weekly-death-registrations-northern-ireland

Author(s): Continuous Mortality Investigation

Publication Date: July 2022

Publication Site: Actuaries UK

Think You’ve Never Had Covid-19? Think Again

Link: https://www.wsj.com/articles/think-youve-never-had-covid-19-think-again-11658741403

Graphic:

Excerpt:

Dr. Ding is a member of a shrinking club of people who are pretty sure they have never been infected with SARS-CoV-2, the virus that causes Covid-19. Geneticists and immunologists are studying factors that might protect people from infection, and learning why some are predisposed to more severe Covid-19 disease.

For many, the explanation is likely that they have in fact been infected with the virus at some point without realizing it, said Susan Kline, professor of medicine at the University of Minnesota Medical School. About 40% of confirmed Covid-19 cases are asymptomatic, according to a meta-analysis published in December in the Journal of the American Medical Association.

More than two years into the pandemic, most people worldwide have likely been infected with the virus at least once, epidemiologists said. Some 58% of people in the U.S. had contracted Covid-19 through February, the Centers for Disease Control and Prevention has estimated. Since then, a persistent wave driven by offshoots of the infectious Omicron variant has kept daily known cases in the U.S. above 100,000 for weeks.

Yet some people haven’t gotten sick or tested positive.

Author(s): Julie Wernau

Publication Date: 25 Jul 2022

Publication Site: WSJ

Insurance Industry Outlook

Link: https://www.selbyjennings.com/blog/2022/02/insurance-industry-outlook

Excerpt:

In health insurance, with the continual spike in Medicare, we forecast a huge shift towards this area and Medicaid in 2022, and beyond. With the way that the market has evolved, it’s possible that actuaries with experience in Medicare will be in-demand, especially as bid season is fast approaching. Alongside proficiency in risk adjustment, the Society of Actuaries (SOA) recently added a new exam for predictive analytics.

As always, for the property & casualty sector, the key modelling skillsets going into 2022 is R and Python. With the rise in cyber and ransomware attacks, this might result in a boom in cyber insurance and simultaneously the specialists, minimum of 2-3 years in underwriting, to better service this demand. In addition to fluency in modelling, designations from Associates of the Casualty Actuary Society (ACAS) and Fellowship of the Casualty Actuary Society (FCAS), has importance to employers and therefore significant currency in the market.

Publication Date: July 2022

Publication Site: Selby Jennings