Graphic:
Excerpt:
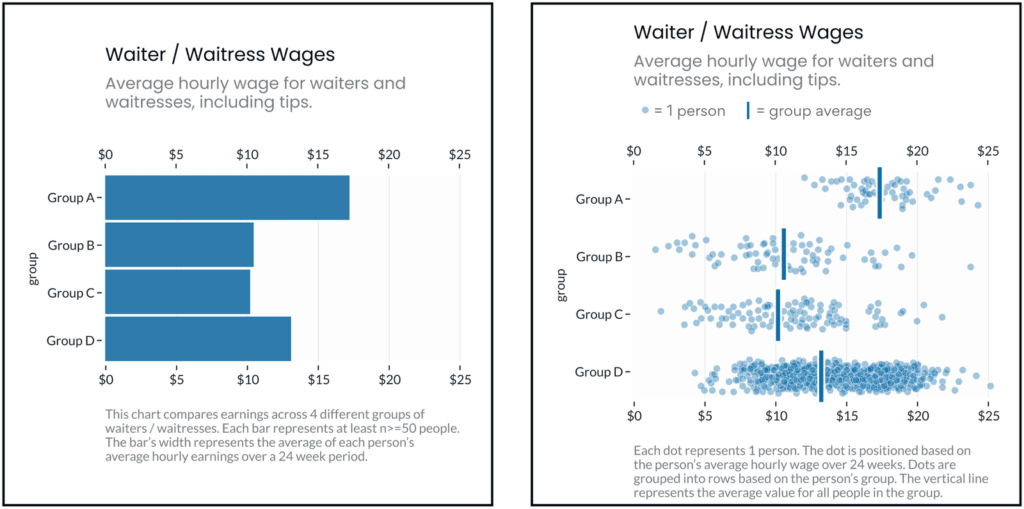
Ignoring or deemphasizing uncertainty in dataviz can create false impressions of group homogeneity (low outcome variance). If stereotypes stem from false impressions of group homogeneity, then the way visualizations represent uncertainty (or choose to ignore it) could exacerbate these false impressions of homogeneity and mislead viewers toward stereotyping.
If this is the case, then social-outcome-disparity visualizations that hide within-group variability (e.g. a bar chart without error bars) would elicit more harmful stereotyping than visualizations that emphasize within-group variance (e.g. a jitter plot).
Author(s): Stephanie Evergreen
Publication Date: 2 Aug 2022
Publication Site: 3iap