Statistics with Zhuangzi

Link: https://tsangchungshu.medium.com/statistics-with-zhuangzi-b75910c72e50

Graphic:
Excerpt:

The next section is another gratuitous dunk on Confucius, but it’s also a warning about the perils of seeing strict linear relationships where there are none. Not only will you continually be disappointed/frustrated, you won’t know why.

In this story, Laozi suggests that Confucius’ model of a world in which every additional unit of virtue accumulated will receive its corresponding unit of social recognition is clearly not applicable to the age in which they lived.

Moreover, this results in a temptation is to blame others for not living up to your model. Thus, in the years following the 2007 crash, Lehman brothers were apostrophised for their greed, but in reality all they had done was respond as best they could to the incentives that society gave them. If we wanted them to behave less irresponsibly, we should have pushed government to adjust their incentives. They did precisely what we paid them to. If we didn’t want this outcome, we should have anticipated it and paid for something else.

Author(s): Ts’ang Chung-shu

Publication Date: 20 Sept 2021

Publication Site: Medium
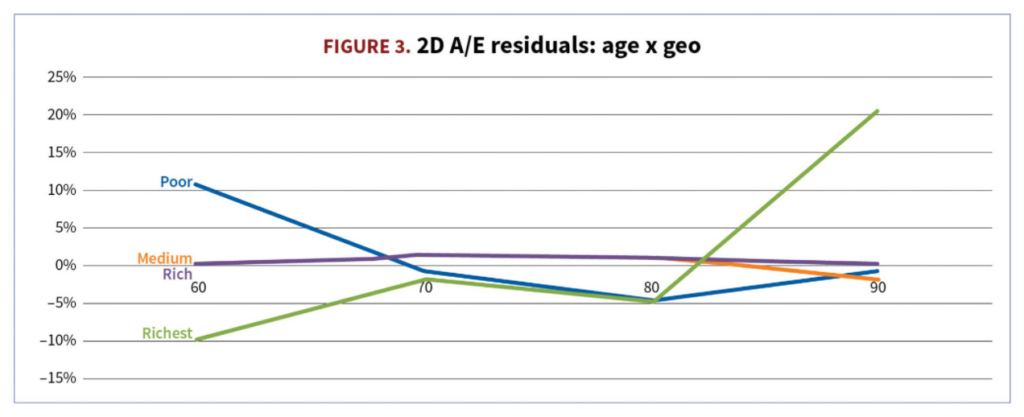
Applying Predictive Analytics for Insurance Assumptions—Setting Practical Lessons

Graphic:

Excerpt:

3. Identify pockets of good and poor model performance. Even if you can’t fix it, you can use this info in future UW decisions. I really like one- and two-dimensional views (e.g., age x pension amount) and performance across 50 or 100 largest plans—this is the precision level at which plans are actually quoted. (See Figure 3.)

What size of unexplained A/E residual is satisfactory at pricing segment level? How often will it occur in your future pricing universe? For example, 1-2% residual is probably OK. Ten to 20% in a popular segment likely indicates you have a model specification issue to explore.

Positive residuals mean that actual mortality data is higher than the model predicts (A>E). If the model is used for pricing this case, longevity pricing will be lower than if you had just followed the data, leading to a possible risk of not being competitive. Negative residuals mean A<E, predicted mortality being too high versus historical data, and a possible risk of price being too low.

Author(s): Lenny Shteyman, MAAA, FSA, CFA

Publication Date: September/October 2021

Publication Site: Contingencies

Predictably inaccurate: The prevalence and perils of bad big data

Link: https://www2.deloitte.com/us/en/insights/deloitte-review/issue-21/analytics-bad-data-quality.html

Graphic:

Excerpt:

More than two-thirds of survey respondents stated that the third-party data about them was only 0 to 50 percent correct as a whole. One-third of respondents perceived the information to be 0 to 25 percent correct.

Whether individuals were born in the United States tended to determine whether they were able to locate their data within the data broker’s portal. Of those not born in the United States, 33 percent could not locate their data; conversely, of those born in the United States, only 5 percent had missing information. Further, no respondents born outside the United States and residing in the country for less than three years could locate their data.

The type of data on individuals that was most available was demographic information; the least available was home data. However, even if demographic information was available, it was not all that accurate and was often incomplete, with 59 percent of respondents judging their demographic data to be only 0 to 50 percent correct. Even seemingly easily available data types (such as date of birth, marital status, and number of adults in the household) had wide variances in accuracy.

Author(s): John Lucker, Susan K. Hogan, Trevor Bischoff

Publication Date: 31 July 2017

Publication Site: Deloitte

SYSTEMIC DISCRIMINATION AMONG LARGE U.S. EMPLOYERS

Link: https://eml.berkeley.edu//~crwalters/papers/randres.pdf

Graphic:

Abstract:

We study the results of a massive nationwide correspondence experiment sending more than
83,000 fictitious applications with randomized characteristics to geographically dispersed jobs
posted by 108 of the largest U.S. employers. Distinctively Black names reduce the probability of
employer contact by 2.1 percentage points relative to distinctively white names. The magnitude
of this racial gap in contact rates differs substantially across firms, exhibiting a between-company
standard deviation of 1.9 percentage points. Despite an insignificant average gap in contact rates
between male and female applicants, we find a between-company standard deviation in gender
contact gaps of 2.7 percentage points, revealing that some firms favor male applicants while
others favor women. Company-specific racial contact gaps are temporally and spatially persistent,
and negatively correlated with firm profitability, federal contractor status, and a measure of
recruiting centralization. Discrimination exhibits little geographical dispersion, but two digit
industry explains roughly half of the cross-firm variation in both racial and gender contact gaps.
Contact gaps are highly concentrated in particular companies, with firms in the top quintile of
racial discrimination responsible for nearly half of lost contacts to Black applicants in the
experiment. Controlling false discovery rates to the 5% level, 23 individual companies are found
to discriminate against Black applicants. Our findings establish that systemic illegal
discrimination is concentrated among a select set of large employers, many of which can be
identified with high confidence using large scale inference methods.

Author(s): Patrick M. Kline, Evan K. Rose, and Christopher R. Walters

Publication Date: July 2021, Revised August 2021

Publication Site: NBER Working Papers, also Christopher R. Walters’s own webpages

Autocorrect errors in Excel still creating genomics headache

Link: https://www.nature.com/articles/d41586-021-02211-4

Graphic:

Excerpt:

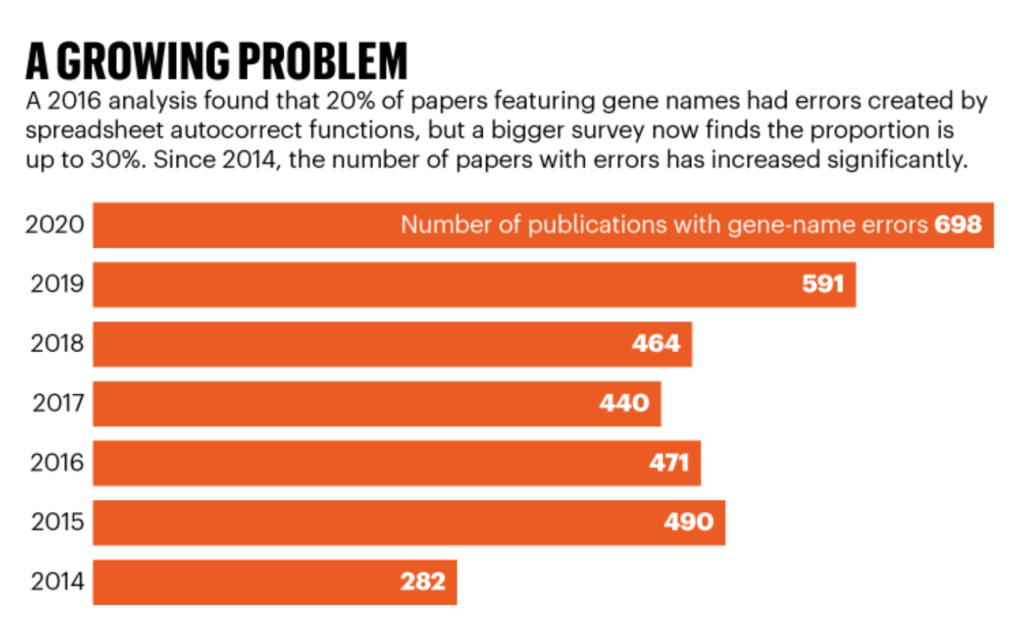
In 2016, Mark Ziemann and his colleagues at the Baker IDI Heart and Diabetes Institute in Melbourne, Australia, quantified the problem. They found that one-fifth of papers in top genomics journals contained gene-name conversion errors in Excel spreadsheets published as supplementary data2. These data sets are frequently accessed and used by other geneticists, so errors can perpetuate and distort further analyses.

However, despite the issue being brought to the attention of researchers — and steps being taken to fix it — the problem is still rife, according to an updated and larger analysis led by Ziemann, now at Deakin University in Geelong, Australia3. His team found that almost one-third of more than 11,000 articles with supplementary Excel gene lists published between 2014 and 2020 contained gene-name errors (see ‘A growing problem’).

Simple checks can detect autocorrect errors, says Ziemann, who researches computational reproducibility in genetics. But without those checks, the errors can easily go unnoticed because of the volume of data in spreadsheets.

Author(s): Dyani Lewis

Publication Date: 13 August 2021

Publication Site: nature

Israeli data: How can efficacy vs. severe disease be strong when 60% of hospitalized are vaccinated?

Link: https://www.covid-datascience.com/post/israeli-data-how-can-efficacy-vs-severe-disease-be-strong-when-60-of-hospitalized-are-vaccinated

Graphic:

Excerpt:

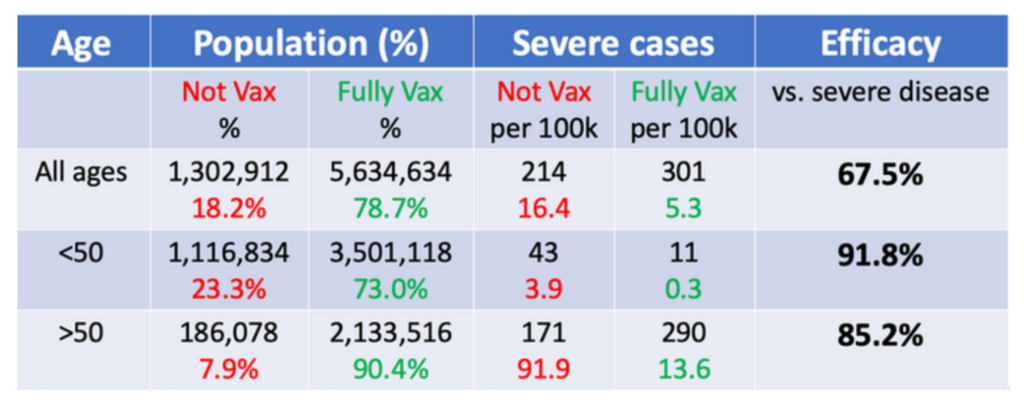
These efficacies are quite high and suggests the vaccines are doing a very good job of preventing severe disease in both older and young cohorts. These levels of efficacy are much higher than the 67.5% efficacy estimate we get if the analysis is not stratified by age. How can there be such a discrepancy between the age-stratified and overall efficacy numbers?

This is an example of Simpson’s Paradox, a well-known phenomenon in which misleading results can sometimes be obtained from observational data in the presence of confounding factors.

Author(s): Jeffrey Morris

Publication Date: 17 August 2021

Publication Site: Covid-19 Data Science

Machine Learning: The Mathematics of Support Vector Machines – Part 1

Link: https://www.yengmillerchang.com/post/svm-lin-sep-part-1/

Graphic:

Excerpt:

Introduction

The purpose of this post is to discuss the mathematics of support vector machines (SVMs) in detail, in the case of linear separability.

Background

SVMs are a tool for classification. The idea is that we want to find two lines (linear equations) so that a given set of points are linearly separable according to a binary classifier, coded as ±1, assuming such lines exist. These lines are given by the black lines given below.

Author(s): Yeng Miller-Chang

Publication Date: 6 August 2021

Publication Site: Math, Music Occasionally, and Stats

Restrict Insurers’ Use Of External Consumer Data, Colorado Senate Bill 21-169

Link: https://leg.colorado.gov/sites/default/files/2021a_169_signed.pdf

Link: https://leg.colorado.gov/bills/sb21-169

Excerpt:

The general assembly therefore declares that in order to ensure
that all Colorado residents have fair and equitable access to insurance
products, it is necessary to:
(a) Prohibit:
(I) Unfair discrimination based on race, color, national or ethnic
origin, religion, sex, sexual orientation, disability, gender identity, or gender
expression in any insurance practice; and
(II) The use of external consumer data and information sources, as
well as algorithms and predictive models using external consumer data and
information sources, which use has the result of unfairly discriminating
based on race, color, national or ethnic origin, religion, sex, sexual
orientation, disability, gender identity, or gender expression; and
(b) After notice and rule-making by the commissioner of insurance,
require insurers that use external consumer data and information sources,
algorithms, and predictive models to control for, or otherwise demonstrate
that such use does not result in, unfair discrimination.

Publication Date: 6 July 2021

Publication Site: Colorado Legislature

“Why Should I Trust You?” Explaining the Predictions of Any Classifier

Link: https://www.kdd.org/kdd2016/papers/files/rfp0573-ribeiroA.pdf

DOI: http://dx.doi.org/10.1145/2939672.2939778

Graphic:

Excerpt:

Despite widespread adoption, machine learning models remain mostly black boxes. Understanding the reasons behind
predictions is, however, quite important in assessing trust,
which is fundamental if one plans to take action based on a
prediction, or when choosing whether to deploy a new model.
Such understanding also provides insights into the model,
which can be used to transform an untrustworthy model or
prediction into a trustworthy one.
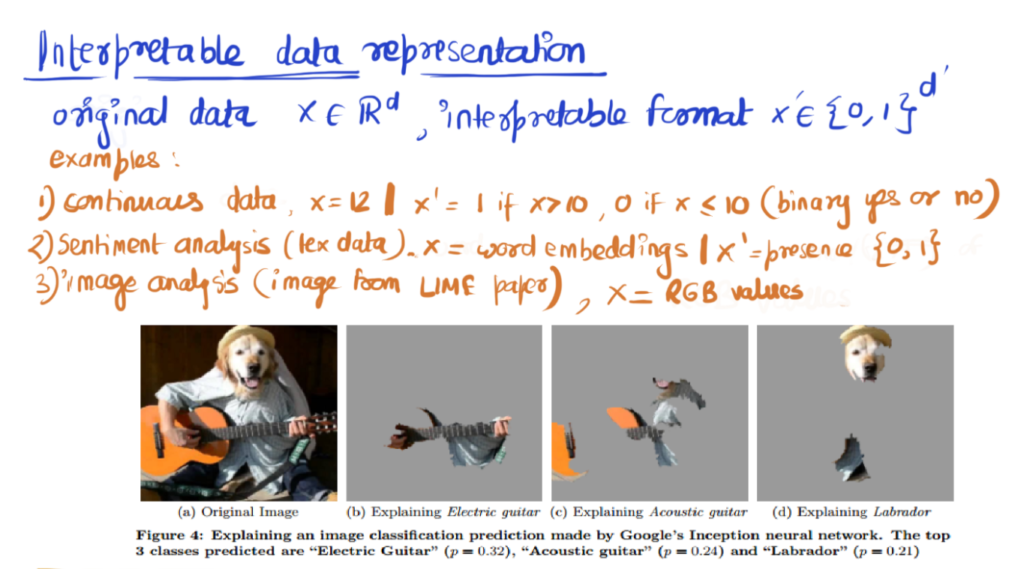
In this work, we propose LIME, a novel explanation technique that explains the predictions of any classifier in an interpretable and faithful manner, by learning an interpretable
model locally around the prediction. We also propose a
method to explain models by presenting representative individual predictions and their explanations in a non-redundant
way, framing the task as a submodular optimization problem. We demonstrate the flexibility of these methods by
explaining different models for text (e.g. random forests)
and image classification (e.g. neural networks). We show the
utility of explanations via novel experiments, both simulated
and with human subjects, on various scenarios that require
trust: deciding if one should trust a prediction, choosing
between models, improving an untrustworthy classifier, and
identifying why a classifier should not be trusted.

Author(s): Marco Tulio Ribeiro, Sameer Singh, Carlos Guestrin

Publication Date: 2016

Publication Site: kdd, Association for Computing Machinery

A Unified Approach to Interpreting Model Predictions

Link: https://papers.nips.cc/paper/2017/file/8a20a8621978632d76c43dfd28b67767-Paper.pdf

Graphic:

Excerpt:

Understanding why a model makes a certain prediction can be as crucial as the
prediction’s accuracy in many applications. However, the highest accuracy for large
modern datasets is often achieved by complex models that even experts struggle to
interpret, such as ensemble or deep learning models, creating a tension between
accuracy and interpretability. In response, various methods have recently been
proposed to help users interpret the predictions of complex models, but it is often
unclear how these methods are related and when one method is preferable over
another. To address this problem, we present a unified framework for interpreting
predictions, SHAP (SHapley Additive exPlanations). SHAP assigns each feature
an importance value for a particular prediction. Its novel components include: (1)
the identification of a new class of additive feature importance measures, and (2)
theoretical results showing there is a unique solution in this class with a set of
desirable properties. The new class unifies six existing methods, notable because
several recent methods in the class lack the proposed desirable properties. Based
on insights from this unification, we present new methods that show improved
computational performance and/or better consistency with human intuition than
previous approaches.

Author(s): Scott M. Lundberg, Su-In Lee

Publication Date: 2017

Publication Site: Conference on Neural Information Processing Systems

Interpretable Machine Learning: A Guide for Making Black Box Models Explainable

Link: https://christophm.github.io/interpretable-ml-book/

Graphic:

Excerpt:

Machine learning has great potential for improving products, processes and research. But computers usually do not explain their predictions which is a barrier to the adoption of machine learning. This book is about making machine learning models and their decisions interpretable.

After exploring the concepts of interpretability, you will learn about simple, interpretable models such as decision trees, decision rules and linear regression. Later chapters focus on general model-agnostic methods for interpreting black box models like feature importance and accumulated local effects and explaining individual predictions with Shapley values and LIME.

All interpretation methods are explained in depth and discussed critically. How do they work under the hood? What are their strengths and weaknesses? How can their outputs be interpreted? This book will enable you to select and correctly apply the interpretation method that is most suitable for your machine learning project.

Author(s): Christoph Molnar

Publication Date: 2021-06-14

Publication Site: github

Idea Behind LIME and SHAP

Link: https://towardsdatascience.com/idea-behind-lime-and-shap-b603d35d34eb

Graphic:

Excerpt:

In machine learning, there has been a trade-off between model complexity and model performance. Complex machine learning models e.g. deep learning (that perform better than interpretable models e.g. linear regression) have been treated as black boxes. Research paper by Ribiero et al (2016) titled “Why Should I Trust You” aptly encapsulates the issue with ML black boxes. Model interpretability is a growing field of research. Please read here for the importance of machine interpretability. This blog discusses the idea behind LIME and SHAP.

Author(s): ashutosh nayak

Publication Date: 22 December 2019

Publication Site: Toward Data Science