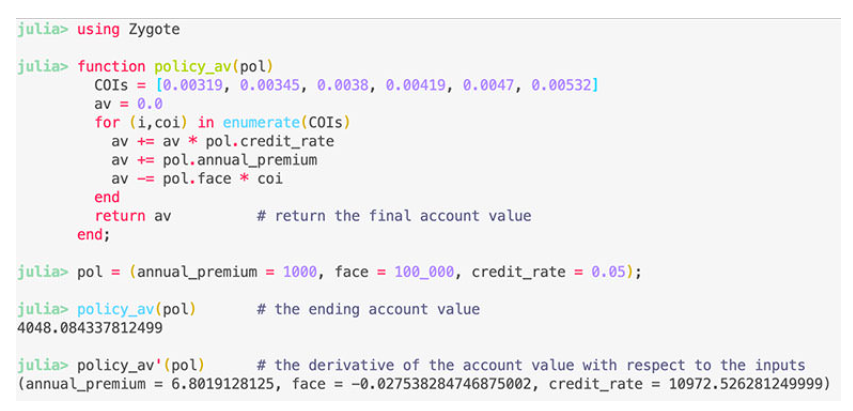
Sensitivity testing is very common in actuarial workflows: essentially, it’s understanding the change in one variable in relation to another. In other words, the derivative!
Julia has unique capabilities where almost across the entire language and ecosystem, you can take the derivative of entire functions or scripts. For example, the following is real Julia code to automatically calculate the sensitivity of the ending account value with respect to the inputs:
When executing the code above, Julia isn’t just adding a small amount and calculating the finite difference. Differentiation is applied to entire programs through extensive use of basic derivatives and the chain rule. Automatic differentiation, has uses in optimization, machine learning, sensitivity testing, and risk analysis. You can read more about Julia’s autodiff ecosystem here.
If you play Wordle daily, or the French version LeMot, you might want to practice more often. For fun, I created an Excel version that you can download, WordXLe. It has sheets for both English and French versions. The dictionaries are:
English main (for validation) c.12000 words from the SOWPODS dictionary; for play c.1100 words.
It uses Conditional Formatting for colouring, Data Validation to enforce some letter entry rules, no VBA macros, just formulas. The sheets are protected, but it’s easy to unhide things in Excel if you really want to so I’ll leave that as a challenge.
In a year when big names from the digital realm profoundly affected the world—Mark Zuckerberg or Julian Assange, take your pick—it’s appropriate to add one more: Douglas Klunder. While largely unnoticed, 2010 marked the 25th anniversary of perhaps the most revolutionary software program ever, Microsoft Excel, and Klunder, now an unassuming attorney and privacy activist for the American Civil Liberties Union in Washington state, gave it to us.
…..
For Doug Klunder, the mission 25 years ago wasn’t so grandiose. As lead developer of Excel, he was handed the job of vaulting Microsoft—then known best for MS-DOS, the operating system in IBM’s PCs—to the forefront in business applications. “We decided it was time to do a new, better spreadsheet,” recalls Klunder, now 50, who joined Microsoft straight out of MIT in 1981 (part of the interview process included lunch with Bill Gates and Steve Ballmer at a Shakey’s pizza parlor).
…..
Klunder and his team came up with “intelligent recalc,” an approach where the program updated only the cells affected by the data change rather than all the formulas in the spreadsheet. Klunder credits Gates with the idea for how to implement the feature—though he says Gates eventually told him he hadn’t implemented what he had in mind at all. Klunder thinks Gates misremembered the discussion, but adds, “Maybe he actually did have a more brilliant idea that now is lost forever.”
Author(s):Thomas E. Weber
Publication Date:14 July 2017 (originally published 2010)
The Bank of England has fined Standard Chartered £46.5m for repeatedly misreporting its liquidity position and for “failing to be open and cooperative” with the regulator.
The Bank’s Prudential Regulation Authority (PRA) said Standard Chartered had made five errors in reporting an important liquidity metric between March 2018 and May 2019, which meant the watchdog did not have a reliable overview of the bank’s US dollar liquidity position.
…..
One of the errors occurred in November 2018, as a result of a mistake in a spreadsheet entry. A positive amount was included when a zero or negative value was expected, leading to an $7.9bn (£6bn) over-reporting of the bank’s dollar liquidity position.
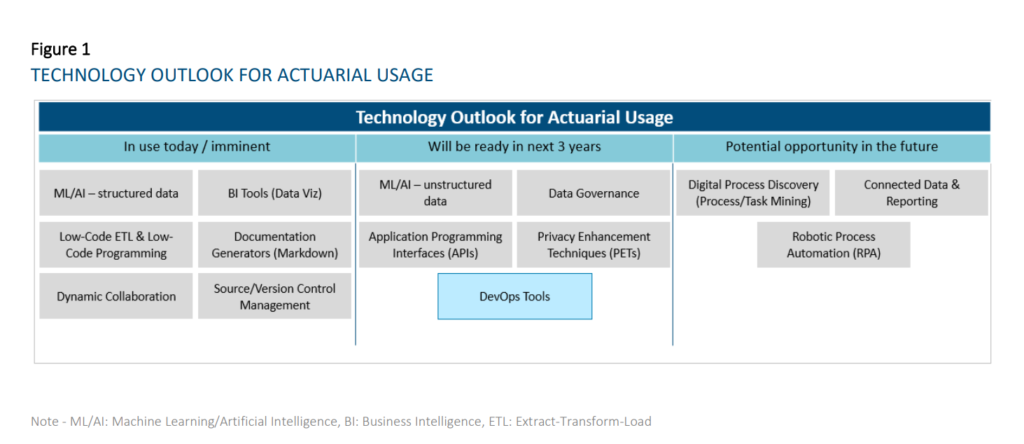
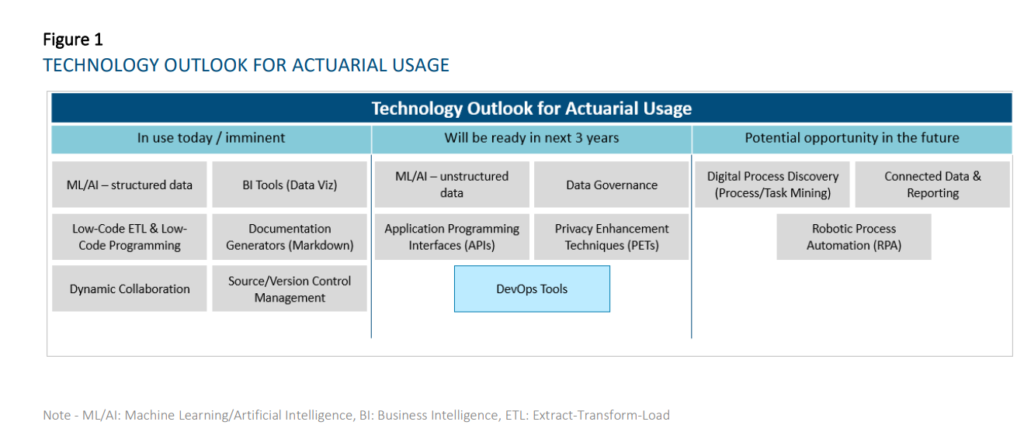
This research evaluates the current state and future outlook of emerging technologies on the actuarial profession over a three-year horizon. For the purpose of this report, a technology is considered to be a practical application of knowledge (as opposed to a specific vendor) and is considered emerging when the use of the particular technology is not already widespread across the actuarial profession. This report looks to evaluate prospective tools that actuaries can use across all aspects and domains of work spanning Life and Annuities, Health, P&C, and Pensions in relation to insurance risk. We researched and grouped similar technologies together for ease of reading and understanding. As a result, we identified the six following technology groups:
Machine Learning and Artificial Intelligence
Business Intelligence Tools and Report Generators
Extract-Transform-Load (ETL) / Data Integration and Low-Code Automation Platforms
Collaboration and Connected Data
Data Governance and Sharing
Digital Process Discovery (Process Mining / Task Mining)
Author(s):
Nicole Cervi, Deloitte Arthur da Silva, FSA, ACIA, Deloitte Paul Downes, FIA, FCIA, Deloitte Marwah Khalid, Deloitte Chenyi Liu, Deloitte Prakash Rajgopal, Deloitte Jean-Yves Rioux, FSA, CERA, FCIA, Deloitte Thomas Smith, Deloitte Yvonne Zhang, FSA, FCIA, Deloitte
Publication Date: October 2021
Publication Site: Society of Actuaries, SOA Research Institute
Move over, League of Legends. Does anyone even care about Overwatch? No, the real future of esports is spreadsheets and Microsoft Excel. Don’t believe us? Then tune in to ESPN3 or YouTube this weekend to find out.
No, this isn’t a joke. The Financial Modeling World Cup will be held this weekend entirely in Microsoft Excel. And the finals (the quarterfinals, semifinals, and the final match) will all be broadcast live as they happen at 9 AM PT. Everyone’s playing for a total prize of $10,000 — funded by Microsoft, of course.
Technologies that have reached widespread adoption today: o Dynamic Collaboration Tools – e.g., Microsoft Teams, Slack, Miro – Most companies are now using this type of technology. Some are using the different functionalities (e.g., digital whiteboarding, project management tools, etc.) more fully than others at this time. • Technologies that are reaching early majority adoption today: o Business Intelligence Tools (Data Visualization component) – e.g., Tableau, Power BI — Most respondents have started their journey in using these tools, with many having implemented solutions. While a few respondents are lagging in its adoption, some companies have scaled applications of this technology to all actuaries. BI tools will change and accelerate the way actuaries diagnose results, understand results, and communicate insights to stakeholders. o ML/AI on structured data – e.g., R, Python – Most respondents have started their journey in using these techniques, but the level of maturity varies widely. The average maturity is beyond the piloting phase amongst our respondents. These are used for a wide range of applications in actuarial functions, including pricing business, modeling demand, performing experience studies, predicting lapses to support sales and marketing, producing individual claims reserves in P&C, supporting accelerated underwriting and portfolio scoring on inforce blocks. o Documentation Generators (Markdown) – e.g., R Markdown, Sphinx – Many respondents have started using these tools, but maturity level varies widely. The average maturity for those who have started amongst our respondents is beyond the piloting phase. As the use of R/Python becomes more prolific amongst actuaries, the ability to simultaneously generate documentation and reports for developed applications and processes will increase in importance. o Low-Code ETL and Low-Code Programming — e.g., Alteryx, Azure Data Factory – Amongst respondents who provided responses, most have started their journey in using these tools, but the level of maturity varies widely. The average maturity is beyond the piloting phase with our respondents. Low-code ETL tools will be useful where traditional ETL tools requiring IT support are not sufficient for business needs (e.g., too difficult to learn quickly for users or reviewers, ad-hoc processes) or where IT is not able to provision views of data quickly enough. o Source Control Management – e.g., Git, SVN – A sizeable proportion of the respondents are currently using these technologies. Amongst these respondents, solutions have already been implemented. These technologies will become more important in the context of maintaining code quality for programming-based models and tools such as those developed in R/Python. The value of the technology will be further enhanced with the adoption of DevOps practices and tools, which blur the lines between Development and Operations teams to accelerate the deployment of applications/programs
Author(s):
Nicole Cervi, Deloitte Arthur da Silva, FSA, ACIA, Deloitte Paul Downes, FIA, FCIA, Deloitte Marwah Khalid, Deloitte Chenyi Liu, Deloitte Prakash Rajgopal, Deloitte Jean-Yves Rioux, FSA, CERA, FCIA, Deloitte Thomas Smith, Deloitte Yvonne Zhang, FSA, FCIA, Deloitte
Individuals have a different kind of relationship with insurance than what they have with any other product or service. Though being the most effective risk mitigation tool, it still requires a hard push from insurers and regulators to make people purchase. The thought of insurance could evoke every other emotion except joy in an individual. The main reason for this is that insurance is a futuristic promise that assures compensation when a covered risk event happens. This operates exactly opposite to the strong impulse of scarcity and immediacy bias.
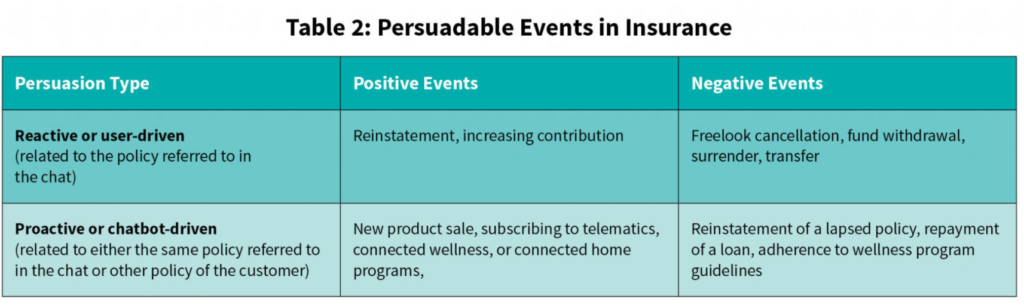
As in any other industry, the persuadable events in insurance could be based on reactive or proactive triggers to encourage positive or discourage negative events. Depending on the intelligence ingrained in the back-end systems and the extent customer data is consolidated, the proactive persuasion events could be personalized to a customer and not just limited to generalized promotion of a new product or program. It could be performed for other persuadable events of the same policy for which the chat is in progress or expand to include policy events from other policies of the customer.
An indicative list of the persuadable events in an insurance policy could be categorized as given in Table 2.
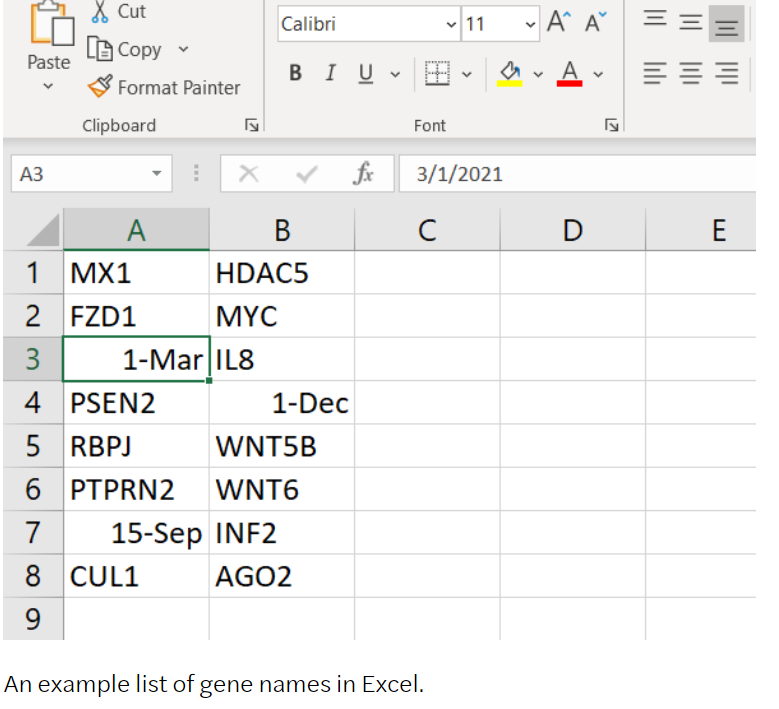
Earlier this year we repeated our analysis. This time we expanded it to cover a wider selection of open access journals, anticipating researchers and journals would be taking steps to prevent such errors appearing in their supplementary data files.
We were shocked to find in the period 2014 to 2020 that 3,436 articles, around 31% of our sample, contained gene name errors. It seems the problem has not gone away, and is actually getting worse.
Author(s): Mark Ziemann, Deakin University and Mandhri Abeysooriya, Deakin University
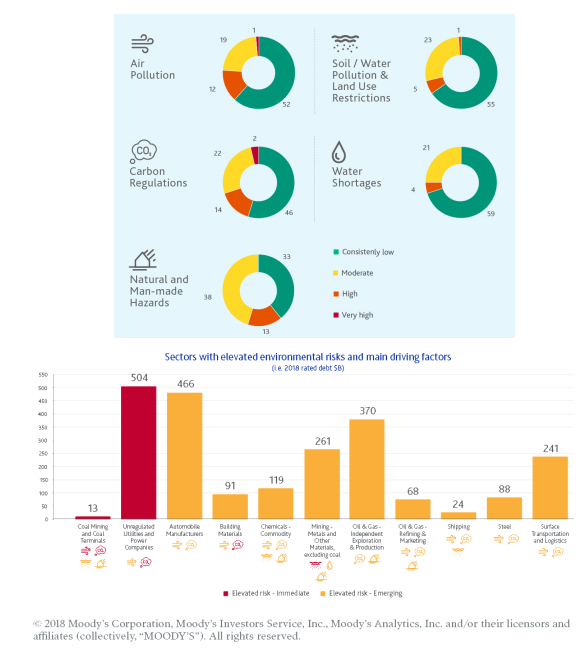
The long-term security of coastal regions depends not simply on climate, oceans and geography, but on multiple local factors, from the politics of foreign aid and investor confidence, to the quality of resilience-oriented designs and ‘managed retreat’.
Take some examples. In 2017, the drought in Cape Town and lack of resilient water infrastructure led to a downgrade by Moody’s. Wildfires in the Trinity Public Utilities District in California led to similar downgrades in 2019. Moody’s have developed a ‘heat map’3 that shows the credit exposure to environmental risk across sectors representing US$74.6 trillion in debt. In the short term, the unregulated utilities and power companies are exposed to ‘elevated risk’. The risks to automobile manufacturers, oil and gas independents and transport companies are growing. Blackrock’s report from April 2019, focused primarily on physical climate risk, showed that securities backed by commercial real estate mortgages could be confronted with losses of up to 3.8 per cent due to storm and flood related cash flow shortages.4 Climate change has already reduced local GDP, with Miami top of the list. The report was amongst the first to link high-level climate risk to location analysis of assets such as plants, property and equipment.
In other words, adaptation and resilience options are also uniquely local. The outcomes hinge on mapping long-term interdependencies to predict physical world changes and explore how core economic and social systems transition to a sustainable world.
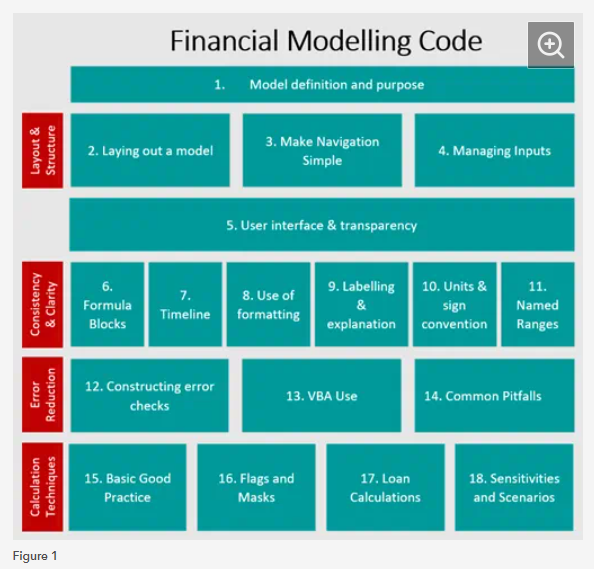
There has been significant disruption in how organisations conduct business and the way we work over the past year and a half. However, financial modellers and developers have had to continue to build, refine and test their models throughout these unprecedented times. Figure 1 below summarises the areas we have covered in the blog series and how they fit together to form the practical guidance of how to follow and implement the Financial Modelling Code.
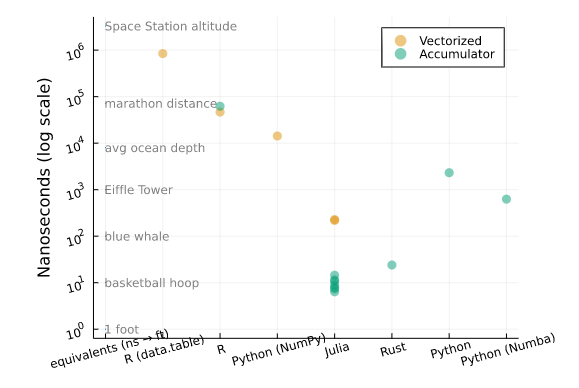
All of the submissions and algorithms above worked, and fast enough that it gave an answer in very little time. And much of the time, the volume of data to process is small enough that it doesn’t matter.
But remember the CUNA Mutual example from above: Let’s say that CUNA’s runtime is already as fast as it can be, and index it to the fastest result in the benchmarks below. The difference between the fastest “couple of days” run and the slowest would be over 721 years. So it’s important to use tools and approaches that are performant for actuarial work.
So for little one-off tasks it doesn’t make a big difference what tool or algorthim is used. More often than not, your one-off calculatons or checks will be done fast enough that it’s not important to be picky. But if wanting to scale your work to a broader application within your company or the industry, I think it’s important to be perfromance-minded[4].