How (not) to deal with missing data: An economist’s take on a controversial study

Link: https://retractionwatch.com/2024/02/21/how-not-to-deal-with-missing-data-an-economists-take-on-a-controversial-study/

Graphic:

Excerpt:

I was reminded of this student’s clever ploy when Frederik Joelving, a journalist with Retraction Watch, recently contacted me about a published paper written by two prominent economists, Almas Heshmati and Mike Tsionas, on green innovations in 27 countries during the years 1990 through 2018. Joelving had been contacted by a PhD student who had been working with the same data used by Heshmati and Tsionas. The student knew the data in the article had large gaps and was “dumbstruck” by the paper’s assertion these data came from a “balanced panel.” Panel data are cross-sectional data for, say, individuals, businesses, or countries at different points in time. A “balanced panel” has complete cross-section data at every point in time; an unbalanced panel has missing observations. This student knew firsthand there were lots of missing observations in these data.

The student contacted Heshmati and eventually obtained spreadsheets of the data he had used in the paper. Heshmati acknowledged that, although he and his coauthor had not mentioned this fact in the paper, the data had gaps. He revealed in an email that these gaps had been filled by using Excel’s autofill function: “We used (forward and) backward trend imputations to replace the few missing unit values….using 2, 3, or 4 observed units before or after the missing units.”  

That statement is striking for two reasons. First, far from being a “few” missing values, nearly 2,000 observations for the 19 variables that appear in their paper are missing (13% of the data set). Second, the flexibility of using two, three, or four adjacent values is concerning. Joelving played around with Excel’s autofill function and found that changing the number of adjacent units had a large effect on the estimates of missing values.

Joelving also found that Excel’s autofill function sometimes generated negative values, which were, in theory, impossible for some data. For example, Korea is missing R&Dinv (green R&D investments) data for 1990-1998. Heshmati and Tsionas used Excel’s autofill with three years of data (1999, 2000, and 2001) to create data for the nine missing years. The imputed values for 1990-1996 were negative, so the authors set these equal to the positive 1997 value.

Author(s): Gary Smith

Publication Date: 21 Feb 2024

Publication Site: Retraction Watch

Exclusive: Elsevier to retract paper by economist who failed to disclose data tinkering

Link: https://retractionwatch.com/2024/02/22/exclusive-elsevier-to-retract-paper-by-economist-who-failed-to-disclose-data-tinkering/

Excerpt:

A paper on green innovation that drew sharp rebuke for using questionable and undisclosed methods to replace missing data will be retracted, its publisher told Retraction Watch.

Previous work by one of the authors, a professor of economics in Sweden, is also facing scrutiny, according to another publisher. 

As we reported earlier this month, Almas Heshmati of Jönköping University mended a dataset full of gaps by liberally applying Excel’s autofill function and copying data between countries – operations other experts described as “horrendous” and “beyond concern.”

Heshmati and his coauthor, Mike Tsionas, a professor of economics at Lancaster University in the UK who died recently, made no mention of missing data or how they dealt with them in their 2023 article, “Green innovations and patents in OECD countries.” Instead, the paper gave the impression of a complete dataset. One economist argued in a guest post on our site that there was “no justification” for such lack of disclosure.

Elsevier, in whose Journal of Cleaner Production the study appeared, moved quickly on the new information. A spokesperson for the publisher told us yesterday: “We have investigated the paper and can confirm that it will be retracted.”

Author(s): Frederik Joelving

Publication Date: 22 Feb 2024

Publication Site: Retraction Watch

[109] Data Falsificada (Part 1): “Clusterfake”

Link: https://datacolada.org/109

Graphic:

Excerpt:

Two summers ago, we published a post (Colada 98: .htm) about a study reported within a famous article on dishonesty (.htm). That study was a field experiment conducted at an auto insurance company (The Hartford). It was supervised by Dan Ariely, and it contains data that were fabricated. We don’t know for sure who fabricated those data, but we know for sure that none of Ariely’s co-authors – Shu, Gino, Mazar, or Bazerman – did it [1]. The paper has since been retracted (.htm).

That auto insurance field experiment was Study 3 in the paper.

It turns out that Study 1’s data were also tampered with…but by a different person.

That’s right:
Two different people independently faked data for two different studies in a paper about dishonesty.

The paper’s three studies allegedly show that people are less likely to act dishonestly when they sign an honesty pledge at the top of a form rather than at the bottom of a form. Study 1 was run at the University of North Carolina (UNC) in 2010. Gino, who was a professor at UNC prior to joining Harvard in 2010, was the only author involved in the data collection and analysis of Study 1 [2].

Author(s): Uri Simonsohn, Leif Nelson, and Joseph Simmons

Publication Date: 17 Jun 2023

Publication Site: Data Colada

Bring ChatGPT INSIDE Excel to Solve ANY Problem Lightning FAST

Link: https://www.youtube.com/watch?v=kQPUWryXwag&ab_channel=LeilaGharani

Video:

Description:

OpenAI inside Excel? How can you use an API key to connect to an AI model from Excel? This video shows you how. You can download the files from the GitHub link above. Wouldn’t it be great to have a search box in Excel you can use to ask any question? Like to create dummy data, create a formula or ask about the cast of the The Sopranos. And then artificial intelligence provides the information directly in Excel – without any copy and pasting! In this video you’ll learn how to setup an API connection from Microsoft Excel to Open AI’s ChatGPT (GPT-3) by using Office Scripts. As a bonus I’ll show you how you can parse the result if the answer from GPT-3 is in more than 1 line. This makes it easier to use the information in Excel.

Author(s): Leila Gharani

Publication Date: 6 Feb 2023

Publication Site: Youtube

Variations On Approximation – An Exploration in Calculation

Link: https://www.soa.org/news-and-publications/newsletters/compact/2014/january/com-2014-iss50/variations-on-approximation–an-exploration-in-calculation/

Graphic:

Excerpt:

Before we get into the different approaches, why should you care about knowing multiple ways to calculate a distribution when we have a perfectly good symbolic formula that tells us the probability exactly?

As we shall soon see, having that formula gives us the illusion that we have the “exact” answer. We actually have to calculate the elements within. If you try calculating the binomial coefficients up front, you will notice they get very large, just as those powers of q get very small. In a system using floating point arithmetic, as Excel does, we may run into trouble with either underflow or overflow. Obviously, I picked a situation that would create just such troubles, by picking a somewhat large number of people and a somewhat low probability of death.

I am making no assumptions as to the specific use of the full distribution being made. It may be that one is attempting to calculate Value at Risk or Conditional Tail Expectation values. It may be that one is constructing stress scenarios. Most of the places where the following approximations fail are areas that are not necessarily of concern to actuaries, in general. In the following I will look at how each approximation behaves, and why one might choose that approach compared to others.

Author(s): Mary Pat Campbell

Publication Date: January 2014

Publication Site: CompAct, SOA

Dataviz Horror Story: How I Crashed the Top Exec’s Email

Link: https://nightingaledvs.com/dataviz-horror-story-how-i-crashed-the-top-execs-email/

Graphic:

Video:

Excerpt:

In my case, the graphs I made looked just fine—it’s just that I didn’t understand how copy/pasting graphs between Excel and Word worked (at the time). This was in the mid-2000s, when memory wasn’t quite so plentiful, so many corporate email accounts had memory quotas. If you hit that quota, you would be locked out of your email account. You had to call IT and actually talk to a person! 

I was a lowly entry-level person at a financial services company and had done some Monte Carlo modeling involving 1,000,000 scenarios. We were developing a new mutual fund project, based on changing allocations over time as people moved towards retirement, and the company wanted me to model outcomes for different allocation trajectories.  After a “full” model run of one million scenarios, I made diagnostic graphs showing the distribution of key metrics (such as the annual accumulation of the fund, how many times the fund decreased while the owner was in retirement, and whether – and when – the money in the fund ran out)  so that we could analyze different potential fund strategies. The graphs themselves were fairly simple. 

Author(s): Mary Pat Campbell

Publication Date: 31 Aug 2022

Publication Site: Nightingale

Data visualization lessons: Jitter charts, screwups, and visionaries

Link: https://marypatcampbell.substack.com/p/data-visualization-lessons-jitter

Video:

Excerpt:

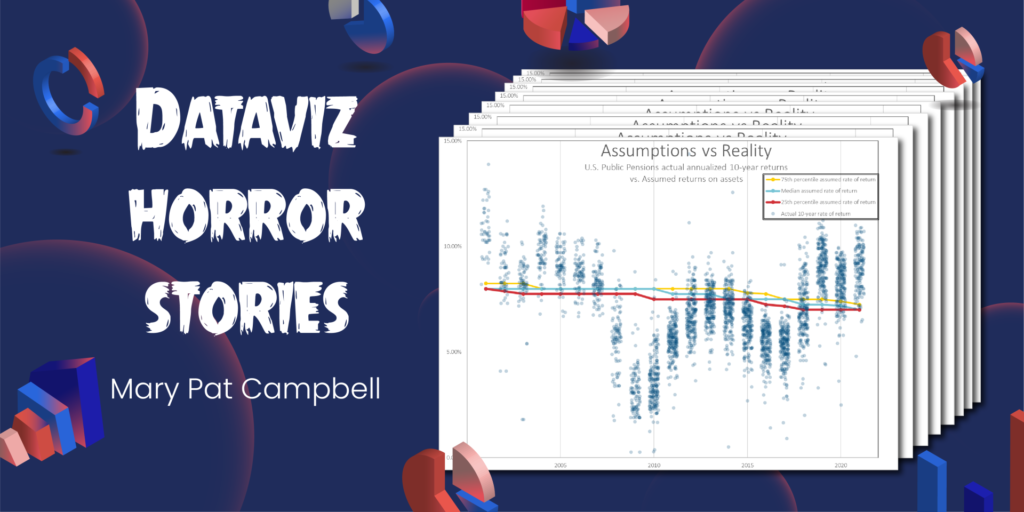
Jitter charts are my new favorite tool for displaying how distributions change over time.

I used them to great effect in my recent post One Bad Year? Comparing the Long-Term Public Pension Fund Returns Against Assumptions.

I’m often looking at distributions, and wanting to communicate something about how those distributions change over time, or how distributions compare. Often, I have to simply pick out key percentiles in those distributions, or key aspects, such as mean and standard deviation.

But why not graph all the points in one’s sample directly, if one has them?

That’s where jitter charts can help.

Author(s): Mary Pat Campbell

Publication Date: 16 Sep 2022

Publication Site: STUMP at substack

Python and Excel Working Together

Link: https://www.joveactuarial.com/blog/python-and-excel/

Graphic:

Excerpt:

When we’re exploring using data science tools for actuarial modelling, we’d often like to keep using existing Excel workbooks, which can contain valuable and trusted models and data.

Fortunately, using Python doesn’t mean abandoning Excel as there are some very powerful tools available that allow closely coupled interaction between the two.

These tools allow us to have the “best of both worlds” combining the ease of use of Excel and the power of Python.

We’re going to start with the simplest options and lead through to ways of building workflows that can contain both Excel workbooks and Python code.

With the range of tools available, it should be possible to have the ‘best of both worlds’: the familiarity of existing Excel workbooks and the power of the Python ecosystem working together.

Finally, if you’d like to learn  more, the author of XLWings, Felix Zumstein, has written an excellent book “Python for Excel“, which covers these topics in more detail. Highly recommended.

Author(s): Carl Dowthwaite

Publication Date: 1 Feb 2022

Publication Site: Jove Actuarial

THE FIRST ANNUAL CAS ACTUARIAL
TECHNOLOGY SURVEY

Link: https://www.casact.org/sites/default/files/2022-03/CAS-RP_First_Annual_CAS_Actuarial_Technology_Survey.pdf

Graphic:

Excerpt:

Excel continues to be actuaries’ most widely used software tool, with more than
94.3% of respondents reporting that they use it at least once a day.
• With that understood, most actuaries (92.3%) use more than one tool.
• Actuaries want to increase their proficiency in R (47.2%), Python (39.1%), SQL
(30.8%), and Excel (26.0%).
• No tool had more than 50% of respondents indicating that they wanted to increase
their proficiency.
• Time is the greatest barrier to learning new technology. (80.5% of respondents felt
so.)
• Newer analysis methods such as tree-based algorithms and artificial intelligence (AI)
are not widely used (16.5% and 7.0%, respectively).

Author(s): Casualty Actuarial Society

Publication Date: March 2022

Publication Site: CAS Research Paper

Police lose hacked therapy center criminal reports after spreadsheet error

Link:https://www.thebharatexpressnews.com/police-lose-hacked-therapy-center-criminal-reports-after-spreadsheet-error/

Excerpt:

The hack into the client database of the private Vastamo psychotherapy center was first exposed on October 21, 2020, when the patient data of tens of thousands of people was stolen and used to blackmail both l company and patients.

Investigators asked each victim to file a criminal complaint, and as of February 2021, more than 25,000 such reports had been submitted. The majority of complaints were lodged at the Pasila police station in Helsinki, but others were lodged elsewhere in the country.

….

Instead of a database, criminal reports were saved via Microsoft Excel files. Some of the files turned out to be unreadable when the police attempted to transfer them into the official system. The cause of the problem is unknown.

Detective Inspector Jari Illukka from the Helsinki Police Department told Svenska Yle that a dozen crime reports had disappeared from Excel, but the exact number is not known.

….

Police estimate that the records of more than 30,000 people were stolen during the Vastaamo data breach, and more than 22,000 of those victims have since reported the crime.

However, a little more than three thousand declaration forms had been given to the police at the end of January, that is to say one victim in ten.

Publication Date: 7 Feb 2022

Publication Site: Bharat Express News

WordXLe: Wordle in Excel

Link:https://sysmod.wordpress.com/2022/01/25/wordxle-wordle-in-excel/

Excerpt:

If you play Wordle daily, or the French version LeMot, you might want to practice more often. For fun, I created an Excel version that you can download, WordXLe. It has sheets for both English and French versions. The dictionaries are:


English main (for validation) c.12000 words from the SOWPODS dictionary; for play c.1100 words.


Version française: principal c.8000 mots; https://github.com/hbenbel/French-Dictionary/blob/master/dictionary/dictionary.txt

Le jeu 1700 mots. https://www.freelang.com/dictionnaire/dic-francais.php
I removed all accents to simplify the game.


It uses Conditional Formatting for colouring, Data Validation to enforce some letter entry rules, no VBA macros, just formulas. The sheets are protected, but it’s easy to unhide things in Excel if you really want to so I’ll leave that as a challenge. 

Author(s): Patrick O’Beirne

Publication Date: 25 Jan 2022

Publication Site: sysmod

Microsoft Excel: The Program’s Designer Reveals The Secrets Behind The Software That Changed the World 25 Years Ago

Link:https://www.thedailybeast.com/microsoft-excel-the-programs-designer-reveals-the-secrets-behind-the-software-that-changed-the-world-25-years-ago

Excerpt:

In a year when big names from the digital realm profoundly affected the world—Mark Zuckerberg or Julian Assange, take your pick—it’s appropriate to add one more: Douglas Klunder. While largely unnoticed, 2010 marked the 25th anniversary of perhaps the most revolutionary software program ever, Microsoft Excel, and Klunder, now an unassuming attorney and privacy activist for the American Civil Liberties Union in Washington state, gave it to us.

…..

For Doug Klunder, the mission 25 years ago wasn’t so grandiose. As lead developer of Excel, he was handed the job of vaulting Microsoft—then known best for MS-DOS, the operating system in IBM’s PCs—to the forefront in business applications. “We decided it was time to do a new, better spreadsheet,” recalls Klunder, now 50, who joined Microsoft straight out of MIT in 1981 (part of the interview process included lunch with Bill Gates and Steve Ballmer at a Shakey’s pizza parlor).

…..

Klunder and his team came up with “intelligent recalc,” an approach where the program updated only the cells affected by the data change rather than all the formulas in the spreadsheet. Klunder credits Gates with the idea for how to implement the feature—though he says Gates eventually told him he hadn’t implemented what he had in mind at all. Klunder thinks Gates misremembered the discussion, but adds, “Maybe he actually did have a more brilliant idea that now is lost forever.”

Author(s):Thomas E. Weber

Publication Date:14 July 2017 (originally published 2010)

Publication Site: Daily Beast