Link: https://jschwabish.substack.com/p/a-tale-of-data-visualization-inspiration
Graphic:

Excerpt:
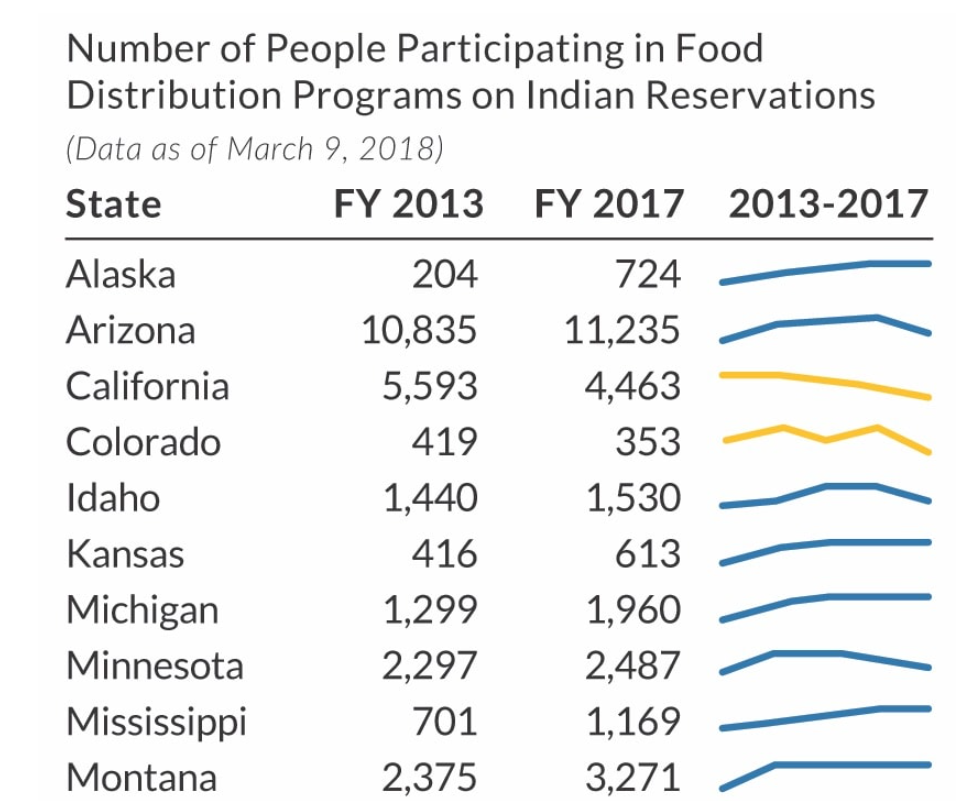
Let’s look at another set of paired charts. These two graphs, one from the EC just last week and the other from Bloomberg in 2014, both use a series of tall and narrow slope charts to compare two values.
In this case, I wouldn’t argue that the EC should attribute Bloomberg’s—after all, they are just slope charts, the topics are different, and the overall design is different. As some other people pointed on out LinkedIn, a designer may begin creating with an echo of another design in their head but not be able pinpoint it (not to mention that some projects no longer live online).
The question remains: where do we draw the line between inspiration and recreation? Is 13 years long enough for a graphic to enter the “pantheon” of visualization techniques, thereby no longer requiring attribution? Or does the uniqueness of the Scarr piece mean that it should always be credited when reused or adapted?
It’s a tough question, and one without an easy answer. It’s clear from Sebastian’s response that he was inspired by Scarr’s original, so my preference would have been to include a citation or reference. But honestly, I’m not even sure where the attribution should go! Maybe under the Source line, or maybe in the Created by line that appears not in the graph but in the newsletter email itself? More questions without clear answers.
In the end, it’s about respecting the creative process. As creators, we all draw from what’s come before us—whether consciously or subconsciously. Acknowledging the work that inspires us not only gives credit where it’s due but also fosters a culture of openness and honesty. It shows respect for our peers and for the community as a whole.
I want to be very clear: this discussion in no way diminishes the fabulous work from The European Correspondent team. I have very much been enjoying their work and I love how they are taking chances with their design decisions, trying new designs and graph types, and being inspired by what people have created before! I’ve been impressed with their ability to distill complex data into short, engaging stories and the near-daily innovative and interesting graphs and charts. I find myself bookmarking two or three of their graphs each week, and adding them to my dataviz catalog. I highly recommend you subscribe to their newsletter. Even if you’re not keenly interested in European news, they are doing some great data visualization work on an almost daily basis, no small feat on its own.
Author(s): Jon Schwabish
Publication Date: 27 Aug 2024
Publication Site: PolicyViz newsletter at substack