Link: https://policyviz.com/2021/02/09/the-cycle-plot/
Graphic:
Excerpt:
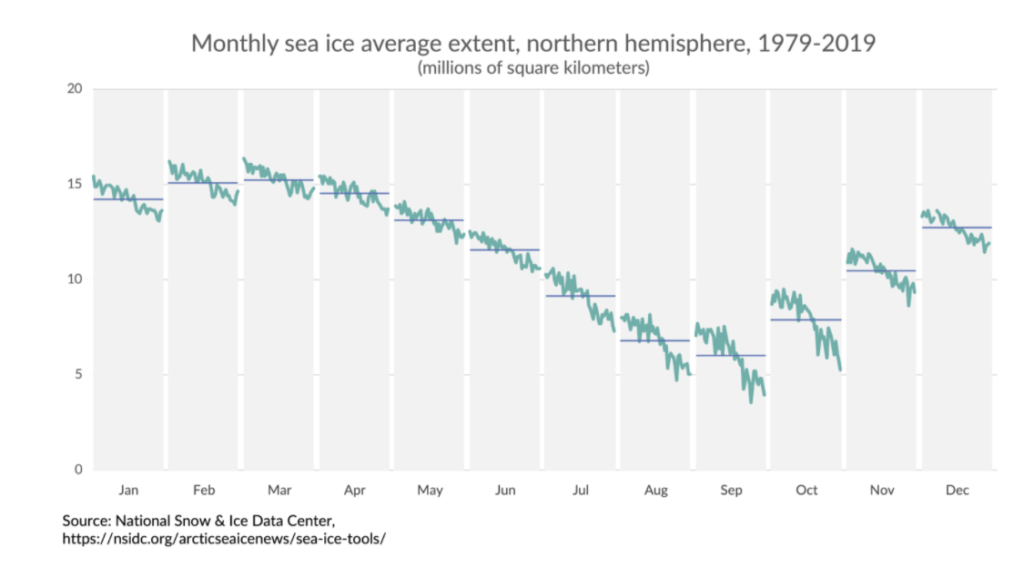
Two primary things came out of last week’s video from Kennedy Elliott about the cycle plot. First, Naomi Robbins shared the original paper where the cycle plot was introduced, which I hadn’t seen before. In William S. Cleveland & Irma J. Terpenning’s Graphical Methods for Seasonal Adjustment (1982) paper, they focus on the importance of seasonal adjustments in various data series and how graphs and charts should be a routine part of the process of seasonally adjusting data.
Spreadsheet link: https://policyviz.com/wp-content/uploads/2021/02/SeaIceIndex_to_share.xlsx
Publication Date: 9 February 2021
Publication Site: PolicyViz