Cigarette Taxes and Cigarette Smuggling by State, 2020

Link: https://taxfoundation.org/cigarette-taxes-cigarette-smuggling-2022/

Graphic:

Excerpt:

Key Findings:

  • Excessive tax rates on cigarettes induce substantial black and gray market movement of tobacco products into high-tax states from low-tax states or foreign sources.
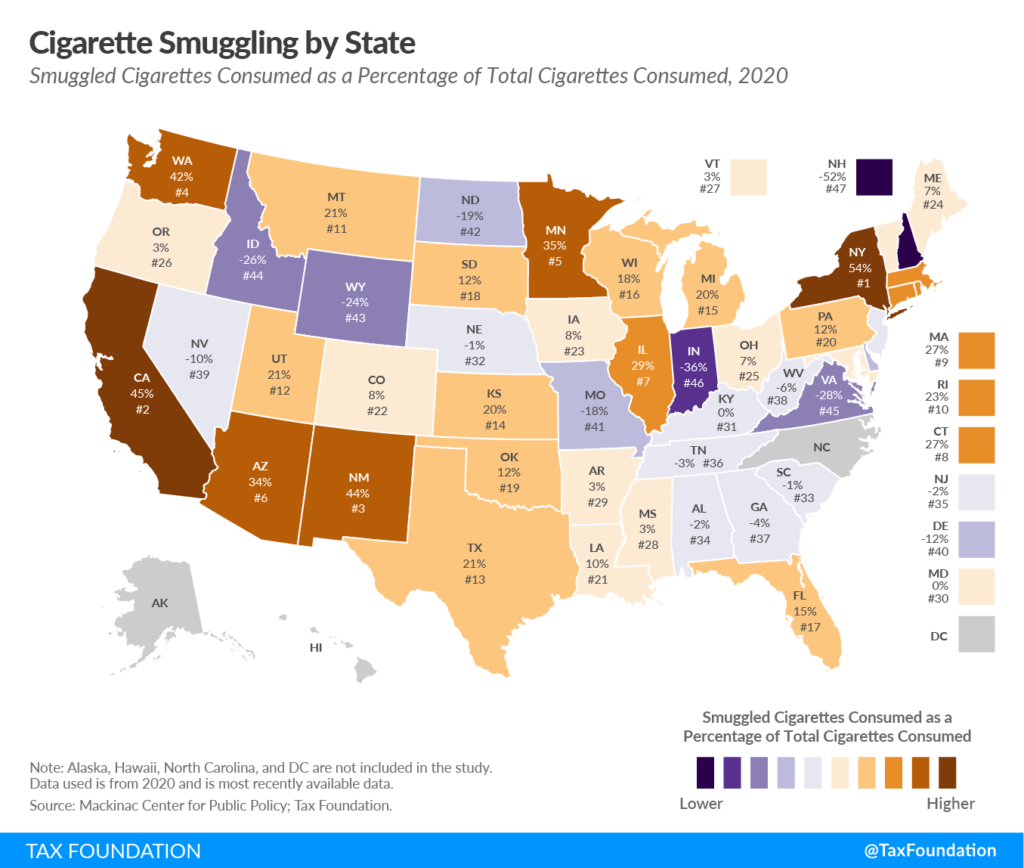
  • New York has the highest inbound smuggling activity, with an estimated 53.5 percent of cigarettes consumed in the state deriving from smuggled sources in 2020. New York is followed by California (44.8 percent), New Mexico (45.5 percent), Washington (41.5 percent), and Minnesota (34.8 percent).
  • New Hampshire has the highest level of net outbound smuggling at 52.4 percent of consumption, likely due to its relatively low tax rates and proximity to high-tax states in the northeastern United States. Following New Hampshire is Indiana (35.6 percent), Virginia (27.6 percent), Idaho (25.8 percent), Wyoming (24.4 percent), and North Dakota (18.6 percent).
  • Illinois and New Mexico significantly increased their cigarette tax rate from 2019 to 2020. Both states saw major increases in cigarette smuggling.
  • Policymakers interested in increasing tax rates should recognize the unintended consequences of high taxation rates. Criminal distribution networks are well-established and illicit trade will grow as tax rates rise.

Author(s): Adam Hoffer

Publication Date: 6 Dec 2022

Publication Site: Tax Foundation

The EU’s Windfall Profits Tax: How “Tax Fairness” Got in the Way of Energy Security

Link: https://taxfoundation.org/windfall-profits-tax-eu-energy-security/

Excerpt:

On 30 September, the Council of the European Union agreed to impose an EU-wide windfall profits tax on fossil fuel companies to fund relief for households and businesses facing high energy prices (due primarily to Putin’s war on Ukraine).

Given the dire economic environment for families and the urgency to transition away from Russian energy, extracting profits from fossil fuel companies to transfer to needy households sounds like killing two birds with one stone. It might even sound fair in a year when oil companies are making record profits because of higher energy prices. 

Unfortunately, it’s not sound policy. If history is any indicator, it will only make these goals harder to achieve.

The tax (or “Solidarity Contribution” in EU-speak) is calculated on taxable profits starting in 2022 and/or 2023, depending on national tax rules, that are above a 20 percent increase of the average yearly taxable profits since 2018. The EU anticipates the policy will raise about €140 billion.

Author(s): Sean Bray

Publication Date: 4 Oct 2022

Publication Site: Tax Foundation

2023 Tax Brackets

Link: https://taxfoundation.org/2023-tax-brackets/

Graphic:

Excerpt:

On a yearly basis the Internal Revenue Service (IRS) adjusts more than 60 tax provisions for inflation to prevent what is called “bracket creep.” Bracket creep occurs when people are pushed into higher income tax brackets or have reduced value from credits and deductions due to inflation, instead of any increase in real income.

The IRS used to use the Consumer Price Index (CPI) as a measure of inflation prior to 2018. However, with the Tax Cuts and Jobs Act of 2017 (TCJA), the IRS now uses the Chained Consumer Price Index (C-CPI) to adjust income thresholds, deduction amounts, and credit values accordingly.

The new inflation adjustments are for tax year 2023, for which taxpayers will file tax returns in early 2024. Note that the Tax Foundation is a 501(c)(3) educational nonprofit and cannot answer specific questions about your tax situation or assist in the tax filing process.

Author(s): Alex Durante

Publication Date: 18 Oct 2022

Publication Site: Tax Foundation

Where Do People Pay the Most in Property Taxes?

Link: https://taxfoundation.org/property-taxes-by-state-county-2022/

Graphic:

Excerpt:

Median property taxes paid vary widely across (and within) the 50 states. The lowest bills in the country are in six counties or county equivalents with median property taxes of less than $200 a year:

  • Northwest Arctic Borough and the Kusivlak Census Area (Alaska)*
  • Avoyelles, East Carroll, and Madison (Louisiana)
  • Choctaw (Alabama)

(*Significant parts of Alaska have no property taxes, though most of these areas have such small populations that they are excluded from federal surveys.)

The next-lowest median property tax of $201 is found in Allen Parish, near the middle of Louisiana, followed by $218 in McDowell County, West Virginia, in the southernmost part of the state.

The eight counties with the highest median property tax payments all have bills exceeding $10,000:

  • Bergen, Essex, and Union (New Jersey)
  • Nassau, New York, Rockland, and Westchester (New York)
  • Falls Church (Virginia)

All but Falls Church are near New York City, as is the next highest, Passaic County, New Jersey ($9,999). 

Author(s): Janelle Fritts

Publication Date: 13 Sept 2022

Publication Site: Tax Foundation

Massachusetts’ Graduated Income Tax Amendment Threatens the Commonwealth’s Economic Transformation

Link: https://taxfoundation.org/massachusetts-graduated-income-tax-amendment/

Graphic:

Excerpt:

Massachusetts is already trending in the wrong direction in terms of migration. Since 2013, Massachusetts’ net population change levels have been trending downward; and in 2020 the Commonwealth realized its first net negative population change since 2004. Massachusetts lost an estimated 1,309 residents in 2020 but that figure grew to 37,497 by 2021. Much of that change is likely attributable to various changes brought on by the pandemic, including the expansion of remote work opportunities. However, Massachusetts’ struggle with migration precedes the pandemic.

The Bay State’s net migration levels generally mirror the downward trajectory of the net population change figures, but a closer look reveals that Massachusetts was experiencing net negative migration even before the pandemic began. The downward trend for net migration reached net negative levels in 2019, the first year since 2007.

Whether Massachusetts’ net migration figure is positive or negative primarily depends on the strength of net international migration. For 20 of the last 22 years, Massachusetts has seen net negative domestic migration. What this effectively means is that it is preferable to migrate to Massachusetts from abroad, but once a person lives there, it is preferable to move somewhere else. Between July 1, 2020 and July 1, 2021, an estimated 12,675 more people moved to the Bay State from abroad than left for foreign destinations. However, 46,187 more people left Massachusetts for other domestic locations than moved in from elsewhere in the United States.[14] This should concern policymakers, but the figure that should be even more concerning is the net outmigration of adjusted gross income (AGI).

Author(s): Timothy Vermeer

Publication Date: 13 Sept 2022

Publication Site: Tax Foundation

Ensuring Tax Rates Don’t Rise with Inflation

Link: https://taxfoundation.org/inflation-tax-legacy/

Graphic:

Excerpt:

With record inflation now squeezing American household budgets, you can thank our Senior Fellow Emeritus Steve Entin for shielding U.S. workers from being pushed into higher tax brackets. If ever there was a paycheck protection program, defending people from bracket creep may be the most important one ever designed.

It all started some 40 years ago. After Ronald Reagan was elected President, Steve Entin, who had previously served as a staff economist on the Joint Economic Committee and studied under notable professors like Milton Friedman at the University of Chicago, was invited to work at the Department of the Treasury as Deputy Assistant Secretary for Economic Policy.

As many at the Tax Foundation can attest, Steve’s stories about his time in the Reagan administration are legendary, but one stands out. Steve did something that every household in America should be grateful for—he convinced President Reagan to call for indexing the tax code to inflation.

At the time, American taxpayers were subject to bracket creep, which occurs when inflation pushes taxpayers into higher income tax brackets or reduces the value of credits, deductions, and exemptions. The bracket thresholds failed to keep pace with inflation, resulting in an increase in income taxes without an increase in real income.

Indeed, President Reagan used the chart that Steve drew for him during a televised address asking Americans to call their members of Congress and demand they index the tax code. People did. And it worked.

Author(s): Scott A. Hodge

Publication Date: 12 Sept 2022

Publication Site: Tax Foundation

State Individual Income Tax Rates and Brackets for 2022

Link:https://taxfoundation.org/state-income-tax-rates-2022

Graphic:

Excerpt:

Individual income taxes are a major source of state government revenue, accounting for 36 percent of state tax collections in fiscal year 2020, the latest year for which data are available.

Forty-two states levy individual income taxes. Forty-one tax wage and salary income, while one state—New Hampshire—exclusively taxes dividend and interest income. Eight states levy no individual income tax at all.

Of those states taxing wages, nine have single-rate tax structures, with one rate applying to all taxable income. Conversely, 32 states and the District of Columbia levy graduated-rate income taxes, with the number of brackets varying widely by state. Hawaii has 12 brackets, the most in the country.

States’ approaches to income taxes vary in other details as well. Some states double their single-bracket widths for married filers to avoid a “marriage penalty.” Some states index tax brackets, exemptions, and deductions for inflation; many others do not. Some states tie their standard deductions and personal exemptions to the federal tax code, while others set their own or offer none at all.

Author(s): Timothy Vermeer, Katherine Loughead

Publication Date: 15 Feb 2022

Publication Site: Tax Foundation

Massachusetts Should Reject Gross Receipts Taxes

Link:https://taxfoundation.org/massachusetts-gross-receipts-tax/

Graphic:

Excerpt:

The economic harms of the gross receipts tax (GRT) were well understood by the early 20th century. Not only is the tax inequitable, but it is also inefficient and distortionary. That is why most states abandoned GRTs in the early 1900s, as states developed the capacity to administer less harmful taxes. Unfortunately, some policymakers in Massachusetts want to turn back the clock.

Today, only a handful of states levy any variation of the GRT. Those that still rely on them as a significant source of revenue (like Texas, Nevada, Ohio, and Washington) typically do so in lieu of one or more alternative taxes. None of these states imposes a corporate income tax, and Ohio repealed several other business taxes as well when it adopted its GRT.

Some Massachusetts policymakers, however, want to layer a GRT atop the state’s existing corporate income tax. If H.2855 becomes law, it would reduce the competitiveness of the Bay State and increase prices for consumers on already expensive goods and services. To make matters worse, Bay Staters would be asked to shoulder the added tax burden at a time when inflation is already eroding purchasing power at a rate not seen 1982.

Author(s): Timothy Vermeer

Publication Date: 9 Feb 2022

Publication Site: Tax Foundation

Summary of the Latest Federal Income Tax Data, 2022 Update

Link: https://taxfoundation.org/summary-latest-federal-income-tax-data-2022-update?mc_cid=aeb8f14671&mc_eid=4737d05e09

Graphic:

Excerpt:

In 2019, taxpayers filed 148.3 million tax returns, reported earning nearly $11.9 trillion in adjusted gross income, and paid $1.6 trillion in individual income taxes.

The top 1 percent of taxpayers paid a 25.6 percent average individual income tax rate, which is more than seven times higher than taxpayers in the bottom 50 percent (3.5 percent).

The share of reported income earned by the top 1 percent of taxpayers fell to 20.1 percent from 20.9 percent in 2018. The top 1 percent’s share of federal individual income taxes paid fell to 38.8 percent from 40.1 percent.

The top 50 percent of all taxpayers paid 97 percent of all individual income taxes, while the bottom 50 percent paid the remaining 3 percent.

The top 1 percent paid a greater share of individual income taxes (38.8 percent) than the bottom 90 percent combined (29.2 percent).

The Tax Cuts and Jobs Act reduced average tax rates across income groups.

Author(s): Erica York

Publication Date: 19 Jan 2022

Publication Site: Tax Foundation

Americans Moved to Low-Tax States in 2021

Link: https://taxfoundation.org/state-population-change-2021/

Graphic:

Excerpt:

Nationally, the U.S. population only grew by 0.1 percent between July 2020 and July 2021, the lowest rate since the nation’s founding. Pandemic-induced excess deaths, virtually nonexistent international in-migration, and an already-declining birth rate yielded an almost flat population trend nationwide. This, however, belies state-level and regional differences. Whereas the District of Columbia’s population shrunk by 2.8 percent between April 2020 (roughly the start of the pandemic) to July 2021, New York lost 1.8 percent of its population, and Illinois, Hawaii, and California rounded out the top five jurisdictions for population loss, Idaho was gaining 3.4 percent, while Utah, Montana, Arizona, South Carolina, Delaware, Texas, Nevada, Florida, and North Carolina all saw population gains of 1 percent or more.

The picture painted by this population shift is a clear one of people leaving high-tax, high-cost states for lower-tax, lower-cost alternatives. The individual income tax is only one component of overall tax burdens, but it is often highly salient, and is illustrative here. If we include the District of Columbia, then in the top one-third of states for population growth since the start of the pandemic (April 2020 to July 2021 data), the average combined top marginal state and local income tax rate is 3.5 percent, while in the bottom third of states, it is about 7.3 percent.

Author(s): Jared Walczak

Publication Date: 4 Jan 2022

Publication Site: Tax Foundation

Corporate Tax Rates around the World, 2021

Link:https://taxfoundation.org/corporate-tax-rates-by-country-2021/?

Graphic:

Excerpt:

In 2021, 20 countries made changes to their statutory corporate income tax rates. Three countries—Bangladesh, Argentina, and Gibraltar—increased their top corporate tax rates, while 17 countries—including Chile, Tunisia, and France—reduced their corporate tax rates.

Comoros (50 percent), Puerto Rico (37.5 percent), and Suriname (36 percent) are the jurisdictions with the highest corporate tax rates in the world, while Barbados (5.5 percent), Uzbekistan (7.5 percent), and Turkmenistan (8 percent) levy the lowest corporate rates. Fifteen jurisdictions do not impose corporate tax.

The worldwide average statutory corporate income tax rate, measured across 180 jurisdictions, is 23.54 percent. When weighted by GDP, the average statutory rate is 25.44 percent.

Asia has the lowest regional average rate, at 19.62 percent, while Africa has the highest regional average statutory rate, at 27.97 percent. However, when weighted for GDP, Europe has the lowest regional average rate at 23.97 percent and South America has the highest at 31.03 percent.

The average top corporate rate among EU27 countries is 21.30 percent, 23.04 percent among OECD countries, and 69 percent in the G7.

The worldwide average statutory corporate tax rate has consistently decreased since 1980, with the largest decline occurring in the early 2000s.

The average statutory corporate tax rate has declined in every region since 1980.

Author(s): Sean Bray

Publication Date: 9 Dec 2021

Publication Site: Tax Foundation

States Have $95 Billion to Restore their Unemployment Trust Funds—Why Aren’t They Using It?

Link:https://taxfoundation.org/state-unemployment-trust-funds-2021/

Graphic:

Excerpt:

States are permitted to replenish their unemployment compensation (UC) trust funds using the $195.3 billion they received in Fiscal Recovery Funds under the American Rescue Plan Act (ARPA)—and they need the help, having paid out $175 billion in state-funded benefits since the start of the pandemic, in addition to the $661 billion shelled out by the federal government in extended and expanded benefits, for a total of about $836 billion between January 27, 2020 and September 11, 2021.[1]

…..

Pre-pandemic trust fund balances stood at $72.5 billion. Today, aggregate trust fund balances are negative, at -$11.1 billion, reflecting $44.8 billion in indebtedness currently incurred by 10 states and the U.S. Virgin Islands. By federal standards, 34 state accounts are currently insolvent, with $114.6 billion needed to bring them all up to what the federal government regards as minimum adequate levels.

Author(s): Savanna Funkhouser, Jared Walczak

Publication Date: 22 Sept 2021

Publication Site: Tax Foundation