The SALT Deduction Has Always Been Hard to Defend — And to Kill

Link: http://www.taxhistory.org/thp/readings.nsf/ArtWeb/663D98E8EB142B3B852581C6005A9982

Excerpt:

The SALT provision of the 1862 tax disappeared with the income tax itself in 1872. It returned, on paper if not in practice, when the income tax was briefly revived in 1894 (before being struck down by the Supreme Court in the 1895 Pollock decision). But when the income tax returned for good in 1913, it brought the SALT deduction back for the long haul.

Over the decades, the deduction evolved to reflect its fiscal environment. When states began to rely on sales taxes, the deductibility of those levies in the federal system was made explicit. The introduction of the standard deduction in 1944 also reshaped the SALT deduction, reducing its scope dramatically (and shifting the distribution of its benefits up the income scale). Later revisions in the 1960s and 1970s modestly curbed the deduction, but it remained largely intact through the 1980s.

Its survival, however, did not reflect any sort of elite consensus that the deduction was a good idea. Indeed, policy experts were increasingly hostile to it. In earlier decades, the deduction had escaped careful scrutiny, perhaps because it was widely perceived to be necessary in a system marked by high marginal rates; many experts believed that absent the deduction, the combination of federal and state income taxes might have approached confiscatory levels.

Publication Date: 27 October 2017

Publication Site: Tax History Project

PBGC Issues Interim Final Rule on Multiemployer Bailout Plan

Link: https://www.ai-cio.com/news/pbgc-issues-interim-final-rule-on-multiemployer-bailout-plan/

Excerpt:

There are four types of multiemployer plans that are eligible to apply for SFA under the PBGC’s regulation:

A plan in critical and declining status as defined by the Employee Retirement Income Security Act (ERISA) in any plan year beginning in 2020, 2021, or 2022.

A plan that had enacted a suspension of benefits approved under ERISA as of March 11, 2021.

A plan certified to be in critical status as defined by ERISA that has a modified funded percentage of less than 40%, and a ratio of active to inactive participants of less than 2:3, in any plan year beginning in 2020, 2021, or 2022.

A plan that became insolvent for purposes of section 418E of the Internal Revenue Code (IRC) after Dec. 16, 2014, when the Multiemployer Pension Reform Act (MPRA) became law, has remained insolvent, and has not terminated under ERISA as of March 11, 2021.

PBGC has prioritized seven groups of plans that qualify for the aid, ranked by the most impacted plans and participants first. The highest priority is given to applications of plans that are projected to become insolvent under ERISA by March 11, 2022, so that they will not have to reduce participant benefits, and to plans that are already insolvent, to help them reinstate benefits, provide makeup payments to participants and beneficiaries, and restore previously suspended benefits.

Author(s): Christine Giordano

Publication Date: 14 July 2021

Publication Site: ai-CIO

SYSTEMIC DISCRIMINATION AMONG LARGE U.S. EMPLOYERS

Link: https://eml.berkeley.edu//~crwalters/papers/randres.pdf

Graphic:

Abstract:

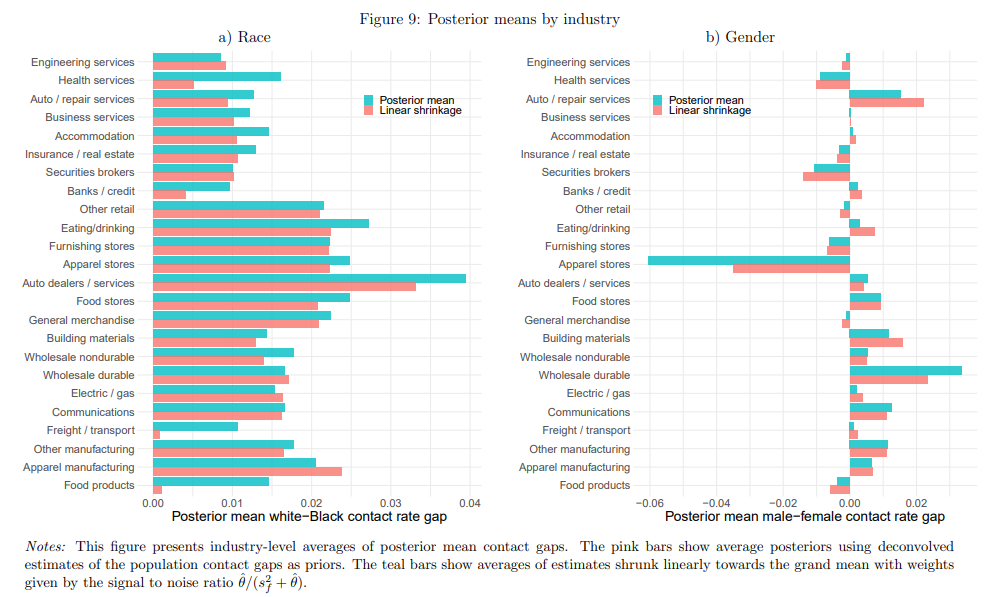
We study the results of a massive nationwide correspondence experiment sending more than
83,000 fictitious applications with randomized characteristics to geographically dispersed jobs
posted by 108 of the largest U.S. employers. Distinctively Black names reduce the probability of
employer contact by 2.1 percentage points relative to distinctively white names. The magnitude
of this racial gap in contact rates differs substantially across firms, exhibiting a between-company
standard deviation of 1.9 percentage points. Despite an insignificant average gap in contact rates
between male and female applicants, we find a between-company standard deviation in gender
contact gaps of 2.7 percentage points, revealing that some firms favor male applicants while
others favor women. Company-specific racial contact gaps are temporally and spatially persistent,
and negatively correlated with firm profitability, federal contractor status, and a measure of
recruiting centralization. Discrimination exhibits little geographical dispersion, but two digit
industry explains roughly half of the cross-firm variation in both racial and gender contact gaps.
Contact gaps are highly concentrated in particular companies, with firms in the top quintile of
racial discrimination responsible for nearly half of lost contacts to Black applicants in the
experiment. Controlling false discovery rates to the 5% level, 23 individual companies are found
to discriminate against Black applicants. Our findings establish that systemic illegal
discrimination is concentrated among a select set of large employers, many of which can be
identified with high confidence using large scale inference methods.

Author(s): Patrick M. Kline, Evan K. Rose, and Christopher R. Walters

Publication Date: July 2021, Revised August 2021

Publication Site: NBER Working Papers, also Christopher R. Walters’s own webpages

We’re Going The Wrong Way

Link: https://www.dailyposter.com/were-going-the-wrong-way/

Graphic:

Excerpt:

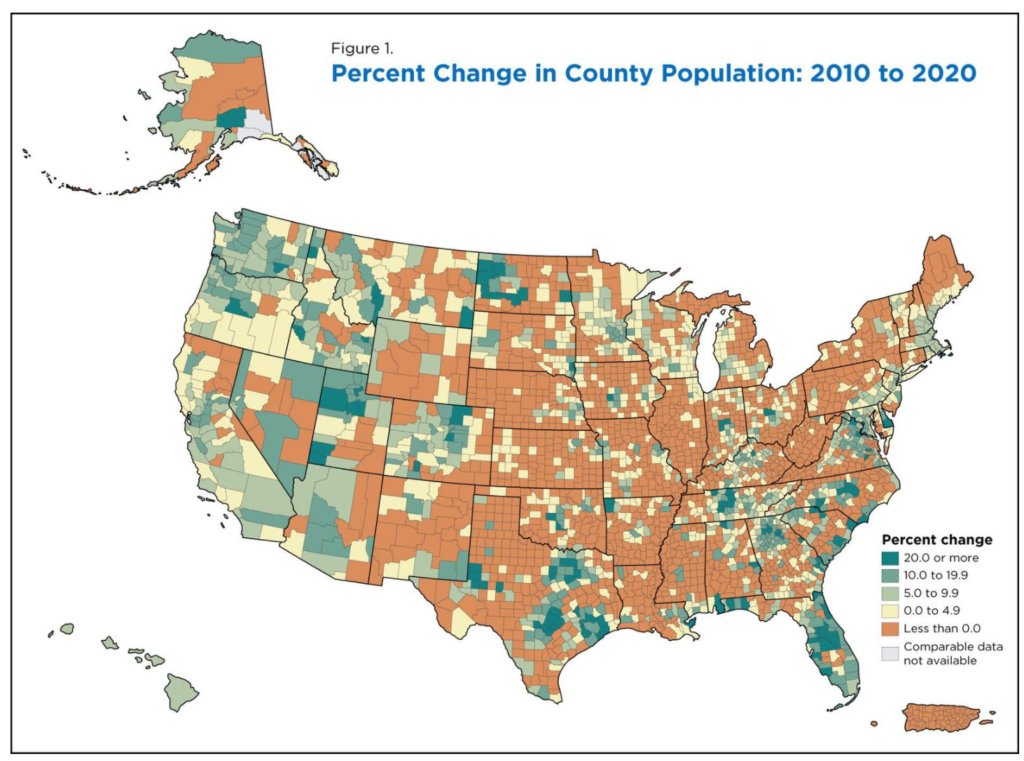
Science has provided America with a decent idea of which areas of our country will be most devastated by climate change, and which areas will be most insulated from the worst effects. Unfortunately, it seems that population flows are going in the wrong direction — today’s new Census data shows a nation moving out of the safer areas and into some of the most dangerous places of all.

…..

Some of the examples are genuinely mind-boggling. For instance, upstate New York is considered one of the country’s most insulated regions in the climate crisis — and yet almost all of upstate New York saw population either nearly flat or declining. At the same time, there were big population increases in and around the Texas gulf coast, which is threatened by extreme heat and coastal flooding.

Similarly, the city of Philadelphia is comparatively well situated in the climate crisis — but it saw only modest population growth of 5 percent. It was surpassed on the list of biggest cities by Phoenix, which saw an 11 percent population growth, despite that city facing some of the worst forms of extreme heat and drought in the entire country.

Author(s): David Sirota, Julia Rock

Publication Date: 12 August 2021

Publication Site: The Daily Poster

Autocorrect errors in Excel still creating genomics headache

Link: https://www.nature.com/articles/d41586-021-02211-4

Graphic:

Excerpt:

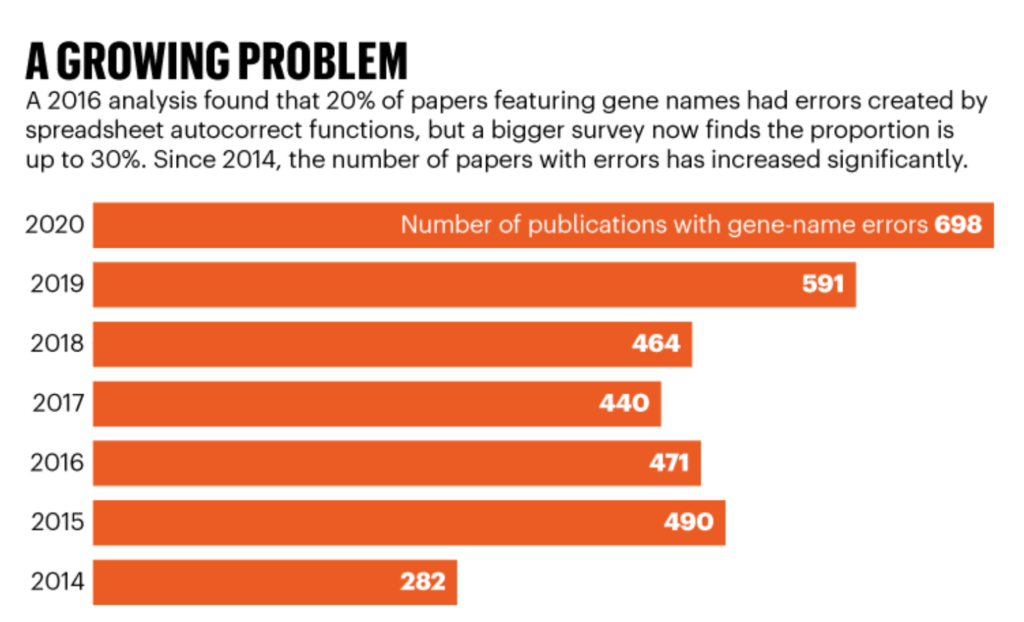
In 2016, Mark Ziemann and his colleagues at the Baker IDI Heart and Diabetes Institute in Melbourne, Australia, quantified the problem. They found that one-fifth of papers in top genomics journals contained gene-name conversion errors in Excel spreadsheets published as supplementary data2. These data sets are frequently accessed and used by other geneticists, so errors can perpetuate and distort further analyses.

However, despite the issue being brought to the attention of researchers — and steps being taken to fix it — the problem is still rife, according to an updated and larger analysis led by Ziemann, now at Deakin University in Geelong, Australia3. His team found that almost one-third of more than 11,000 articles with supplementary Excel gene lists published between 2014 and 2020 contained gene-name errors (see ‘A growing problem’).

Simple checks can detect autocorrect errors, says Ziemann, who researches computational reproducibility in genetics. But without those checks, the errors can easily go unnoticed because of the volume of data in spreadsheets.

Author(s): Dyani Lewis

Publication Date: 13 August 2021

Publication Site: nature

Mortality with Meep: Cause of Death Trend — Cancer — 1999-2020

Link: https://marypatcampbell.substack.com/p/mortality-with-meep-cause-of-death-76e

Video:

Graphic:

Excerpt:

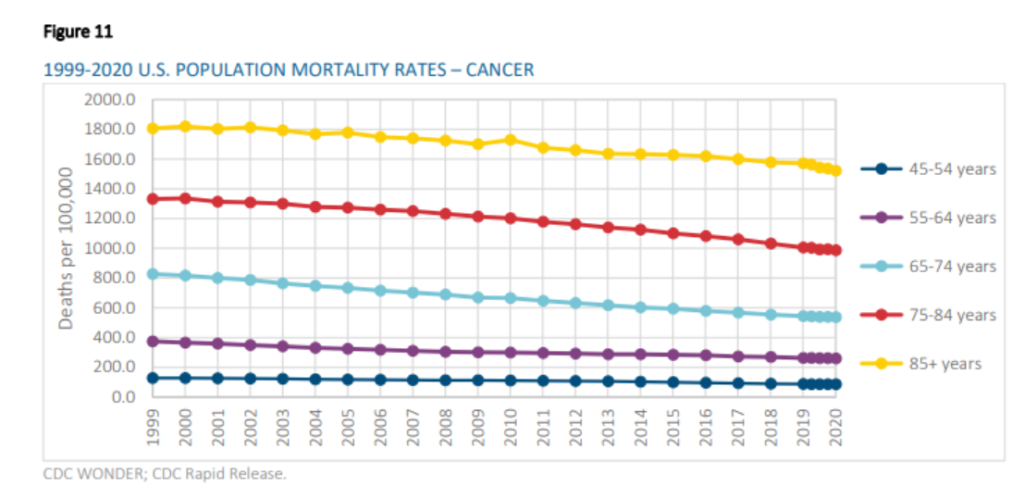
As with heart disease, we see improvement at all ages, but the percentage improvement is not as high with cancer as it was with heart disease.

One of the biggest things, though, is how death rates go up by age group. I will use 2020Q1 cause of death rates to make comparisons, as these are in the SOA report, and the COVID impact didn’t come fully until 2020Q2.

Heart disease death rate for those aged 85+ was 3766 per 100K, and those aged 75-84 was 986. That’s a ratio of 3.8.

Cancer deaths for those aged 85+ was 1562 per 100K, and those aged 75-84 was 1004. That’s a ratio of 1.6.

Two things to note:

Cancer death rate for those age 75-84 was higher than the heart disease death rate for the same group

Heart disease death rates climb much more rapidly than cancer death rates by age

Author(s): Mary Pat Campbell

Publication Date: 4 August 2021

Publication Site: STUMP at substack

Israeli data: How can efficacy vs. severe disease be strong when 60% of hospitalized are vaccinated?

Link: https://www.covid-datascience.com/post/israeli-data-how-can-efficacy-vs-severe-disease-be-strong-when-60-of-hospitalized-are-vaccinated

Graphic:

Excerpt:

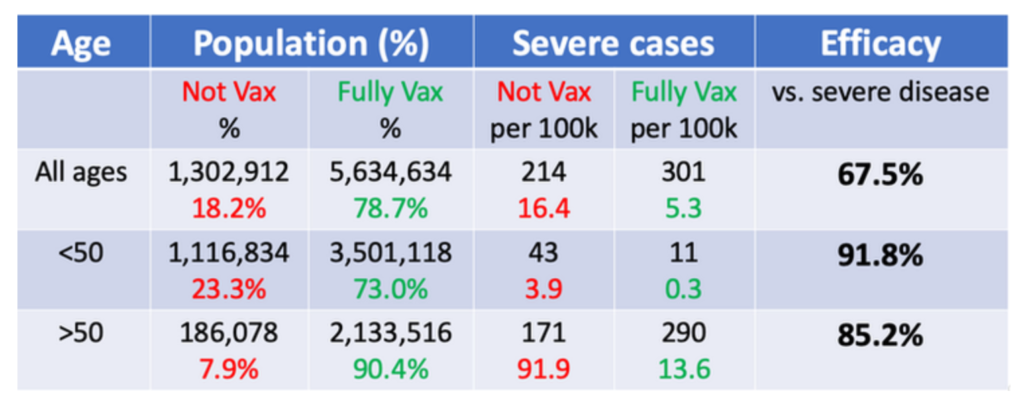
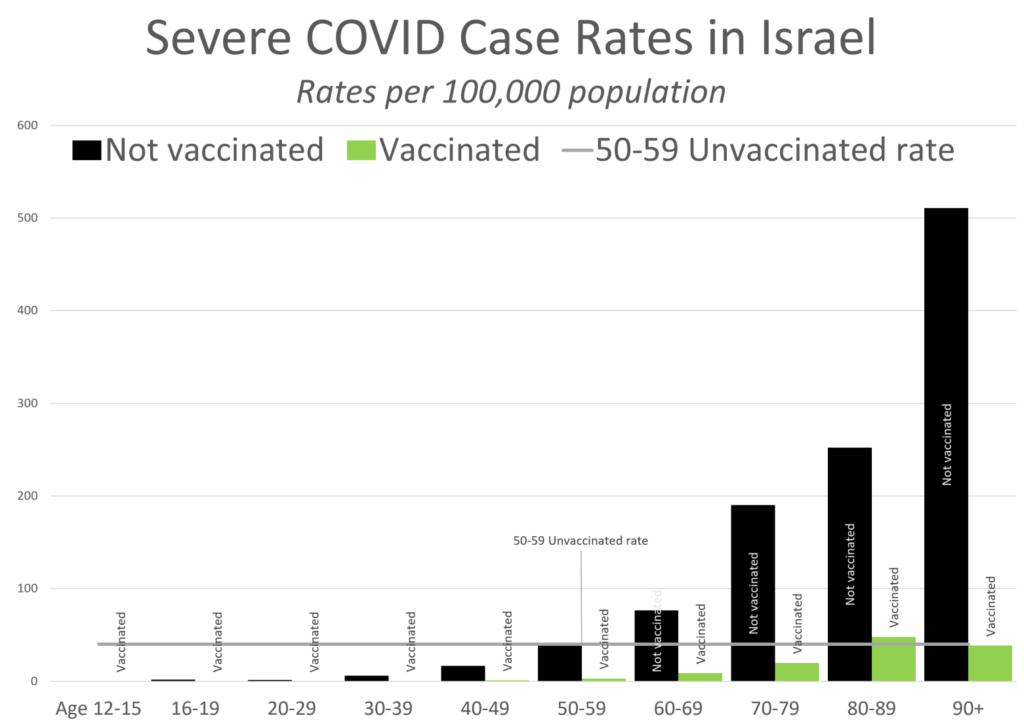
These efficacies are quite high and suggests the vaccines are doing a very good job of preventing severe disease in both older and young cohorts. These levels of efficacy are much higher than the 67.5% efficacy estimate we get if the analysis is not stratified by age. How can there be such a discrepancy between the age-stratified and overall efficacy numbers?

This is an example of Simpson’s Paradox, a well-known phenomenon in which misleading results can sometimes be obtained from observational data in the presence of confounding factors.

Author(s): Jeffrey Morris

Publication Date: 17 August 2021

Publication Site: Covid-19 Data Science

Pandemic of unvaccinated continues to rage as states set new COVID records

Link: https://arstechnica.com/science/2021/08/pandemic-of-unvaccinated-continues-to-rage-as-states-set-new-covid-records/?mc_cid=7fce136b2d&mc_eid=983bcf5922

Graphic:

Excerpt:

At least five states have exceeded their previous peaks of seven-day averages for new daily cases—Florida, Louisiana, Hawaii, Oregon, and Mississippi. Seven states have exceeded their most recent peaks in hospitalizations—Arkansas, Florida, Hawaii, Louisiana, Mississippi, Oregon, and Washington.

Florida in particular has been ablaze with COVID-19. The Sunshine State exceeded its previous record average of around 16,000 new daily cases, which was set in January. The state is now averaging just under 22,000, according to data reported by the Centers for Disease Control and Prevention. As for daily hospitalization tallies, Florida is currently at its all-time record of around 15,000, exceeding its previous highest peak of around 12,000 last July.

Federal health officials noted last week that shipments to Florida containing COVID-19 treatments, including monoclonal antibodies, increased eightfold over the past month. On Tuesday, the Florida Hospital Association reported that it soon expects 75 percent of hospitals in the state to reach critical staffing shortages.

Author(s): Beth Mole

Publication Date: 17 August 2021

Publication Site: Ars Technica

COVID and Simpson’s Paradox: Why So Many Vaccinated People are Among the Current Wave of Hospitalizations

Link: https://marypatcampbell.substack.com/p/covid-and-simpsons-paradox-why-so

Graphic:

Excerpt:

when you’ve got really steep differences between subpopulations and the subpopulations are of very different sizes, the overall population average will be very different from simply looking at the average of the two populations.

Basically:

– The base risk rates for each group are extremely different (3.9 per 100K for young, and 91.9 per 100K for old)
– The percentage each subpopulation makes up in the larger population is very different (67% young, 33% old)
– The vaccination rates are very different by population (76% young, 92% old)

Author(s): Mary Pat Campbell

Publication Date: 19 August 2021

Publication Site: STUMP at substack

Littlewood’s Law and the Global Media

Link: https://www.gwern.net/Littlewood

Excerpt:

This is an interesting one because it illustrates a version of “Littlewood’s Law of Miracles”: in a world with ~8 billion people, one which is increasingly networked and mobile and wealthy at that, a one-in-billion event will happen 8 times a month. Littlewood’s law is itself a special-case of Diaconis & Mosteller 1989’s “the Law of Truly Large Numbers”:

…..

Nevertheless, “it all adds up to normality”!

Because weirdness, however weird or often reported, increasingly tells us nothing about the world at large. If you lived in a small village of 100 people and you heard 10 anecdotes about bad behavior, the extremes are not that extreme, and you can learn from them (they may even give a good idea of what humans in general are like); if you live in a ‘global village’ of 10 billion people and hear 10 anecdotes, you learn… nothing, really, because those few extreme anecdotes represent extraordinary flukes which are the confluence of countless individual flukes, which will never happen again in precisely that way (an expat Iranian fitness instructor is never going to shoot up YouTube HQ again, we can safely say), and offer no lessons applicable to the billions of other people. One could live a thousand lifetimes without encountering such extremes first-hand, rather than vicariously.

…..

More immediately, you should keep your eye on the ball: ask yourself regularly how useful news consumption has really been, and if you justify it as entertainment, how it makes you feel (do you feel entertained or refreshed afterwards?), and if you should spend as much time on it as you do; take Dobelli’s advice try to cut back or ignore recent news (perhaps replace a daily newspaper subscription with a weekly periodical like The Economist and especially stop watching cable news!); shift focus to topics of long-term importance rather than high-frequency noise (eg scientific rather than polling or stock market articles); don’t rely on self-selected convenience samples of news/opinions/responses/anecdotes brought to you by other people, but make your own convenience sample which will at least have different biases and be less extreme (ie don’t go off 10 comments online, ask 10 of your followers instead, or read 10 random stories instead of the top 10 trending stories); don’t have an opinion until you have a fulltext—insist on following back & getting fulltext sources (if you don’t have time to trace something back to its source, then your followers collectively don’t have time to spend reading it)7⁠; read articles to the end (many newspapers, like the New York Times, have a nasty habit of including critical caveats—at the end, where most readers won’t bother to read to); discount things which are “too good to be true”; focus on immediate utility; try to reduce reliance on anecdotes & stories; consider epistemological analogues of robust statistics like simply throwing out the top and bottom percentiles of data; and pay attention to the trends, the big picture, the central tendency, not outliers.

The world is only getting bigger.

Author(s): Gwern

Publication Date: 18 February 2019 (last edited, visited 19 August 2021)

Publication Site: gwern.net
Population Growth Sputters in Midwestern, Eastern States

Link: https://www.pewtrusts.org/en/research-and-analysis/articles/2021/07/27/population-growth-sputters-in-midwestern-eastern-states

Graphic:

Excerpt:

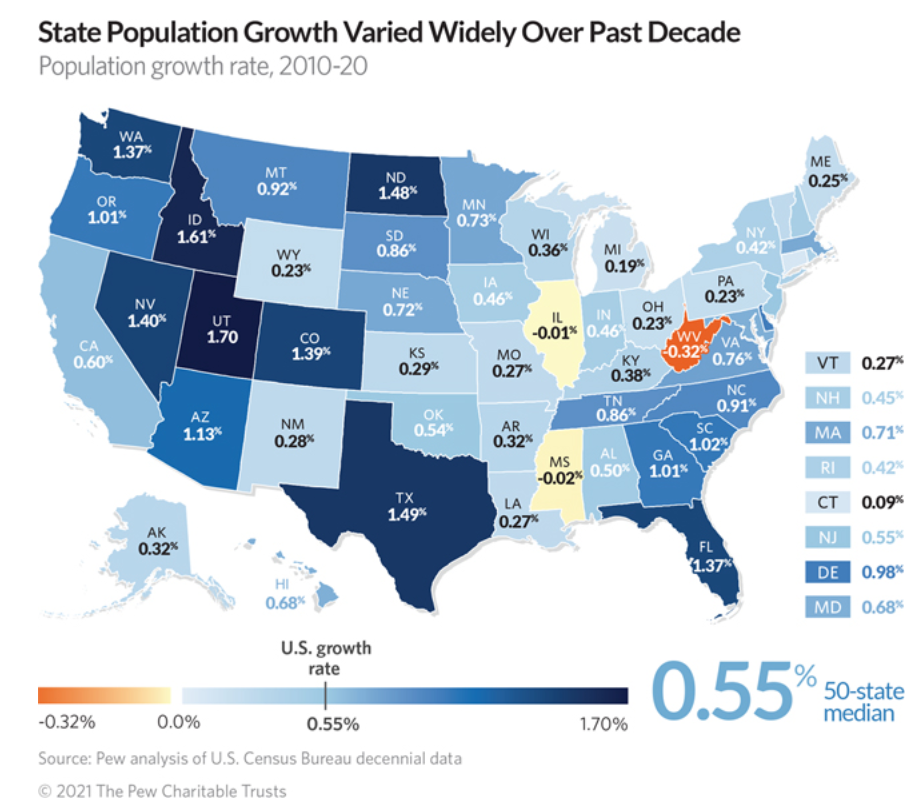
Apart from states with declines—West Virginia, Mississippi, and Illinois—the slowest population growth rates were recorded in Connecticut (0.09%); Michigan (0.19%); and Ohio, Wyoming, and Pennsylvania (0.23% each).

States experiencing their slowest decade of growth ever were Illinois, Connecticut, and six others: Missouri (0.27%), Wisconsin (0.36%), California (0.60%), Hawaii (0.68%), Arizona (1.13%), and Florida (1.37%).

After Utah, Idaho, and Texas, the next fastest-growing states over the past decade were North Dakota (1.48%), Nevada (1.40%), Colorado (1.39%), and Washington and Florida (both 1.37%).

Growth was faster in the 2010s than in the 2000s in only 12 states: Iowa, Louisiana, Massachusetts, Michigan, Nebraska, New Jersey, New York, North Dakota, Ohio, Rhode Island, South Dakota, and Washington.

Author(s): Barb Rosewicz, Melissa Maynard, Alexandre Fall

Publication Date: 27 July 2021

Publication Site: Pew

Washington State’s Tax Revolt

Link: https://www.city-journal.org/cities-balk-at-washington-state-capital-gains-tax

Excerpt:

Five Washington communities—Spokane, Yakima, Spokane Valley, Granger, and Battle Ground—have passed resolutions in recent weeks pledging to outlaw income taxes at the local level if the state adopts income or capital gains taxes. More jurisdictions are promising to follow suit. Local officials are intent on sending the state a message. “Small businesses are the backbone of our local, regional, state, and national economy and it is imperative that the city not put unnecessary hurdles in the way of their success,” Battle Ground’s resolution declared. “Citizens want good government that is fiscally responsible,” Republican state representative Chris Corry argued at a hearing in Yakima. “Putting an income tax ban locally shows a commitment to being fiscally responsible.”

Washington lacks an income tax thanks to a 1932 state Supreme Court ruling that interpreted the state constitution as prohibiting the levy. Over the years, voters have rejected ten attempts to amend the constitution to institute an income tax. The last vote was in 2010, when nearly 65 percent of voters gave a thumbs-down to a ballot initiative heavily supported by the state’s public-sector unions and Bill Gates Sr. (Then-Microsoft CEO Steve Ballmer and Amazon founder Jeff Bezos helped lead the opposition.)

Author(s): Steven Malanga

Publication Date: 16 August 2021

Publication Site: Reason