Link:
https://content.naic.org/sites/default/files/capital-markets-special-reports-bank-loans-ye2023_0.pdf
Graphic:
Executive Summary:
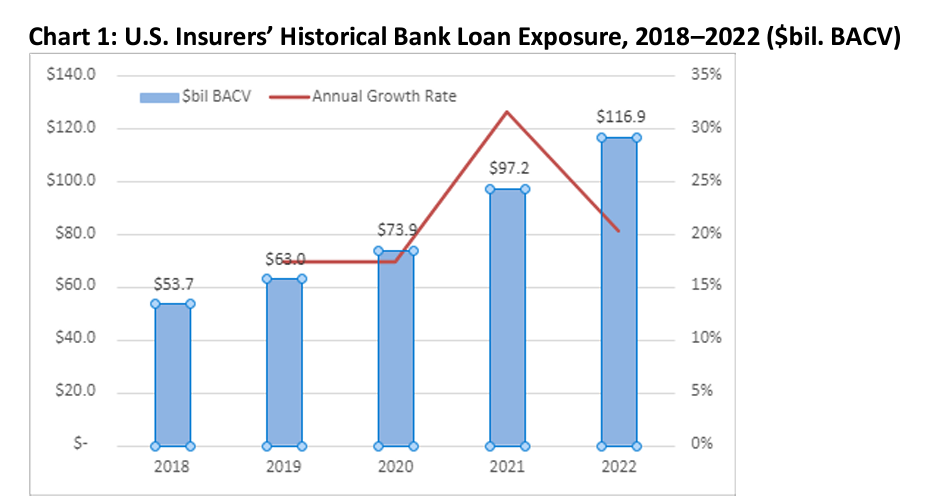
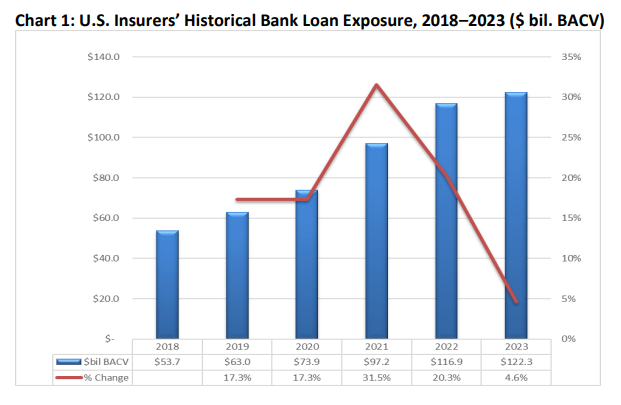
Bank loan investments increased to about $122 billion in book/adjusted carrying value (BACV)
at year-end 2023 from $117 billion at year-end 2022.Despite the 4.6% growth, bank loansremained at 1.4% of U.S. insurers’ total cash and invested
assets at year-end 2023—the same as year-end 2022.Approximately 70% of U.S. insurers’ bank loan investments were acquired, and 85% were held
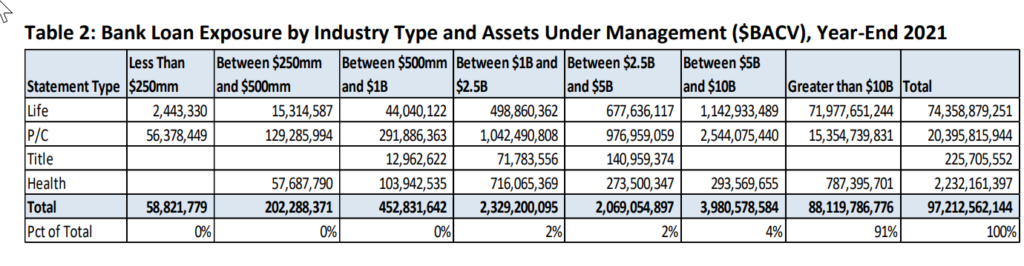
by life companies.In particular, large life companies, or those with more than $10 billion in assets under
management, accounted for 82% of U.S. insurers’ bank loan exposure, up from nearly 80% in
2022.The top 25 insurance companies accounted for 75% of U.S. insurers’ total bank loan
investments at year-end 2023; the top 10 accounted for about 60%.Improvement in credit quality for U.S. insurer-bank loans continued, evidenced by a fourpercentage-point increase in those carrying NAIC 1 and NAIC 2 designations and a
corresponding four-percentage-point decrease in bank loans carrying NAIC 3 and NAIC 4
designations.
Author(s): Jennifer Johnson
Publication Date: 16 July 2024
Publication Site: NAIC Capital Markets Special Report