Link: https://www.soa.org/resources/experience-studies/2022/group-life-covid-19-mortality/
Graphic:
Excerpt:
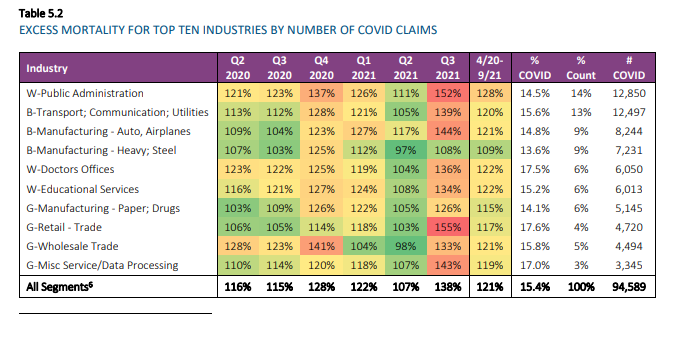
Table 5.2 shows more detailed industry results for the top ten industry segments by number of COVID claims. Most of these industries were in the top ten for the July 2021 report as well. As we now have more quarters with more complete results, both the A/E ratios for April 2020 through September 2021, as well as the COVID claims as a percentage of baseline claims, showed greater consistency across industries than in the previous report. Public Administration continues to be a key driver of high A/E ratios for the White Collar category. Doctors (Healthcare, also White Collar), Retail Trade (Grey Collar), and Misc. Services (Grey Collar) have the highest COVID claims as a percentage of baseline claims. Heavy Steel Manufacturing (Blue Collar) has a much lower A/E ratio than the other top 10 industries. In the table below, “B,” “W,” and “G” refer to Blue Collar, White Collar, and Grey Collar, respectively.
It should be noted that the high A/E ratios for Public Administration are driven by experience in the Executive, Legislative, and General Government segment (Standard Industry Classification [SIC] codes 9100-9199). This segment does not include police and fire and represents over 85% of claims in the broader Public Administration segment.
Video:
Publication Date: January 2022
Publication Site: Society of Actuaries Research Institute